Monitoring Protocols
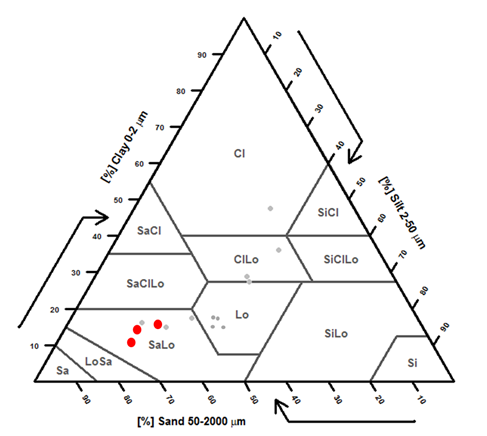
Point Blue’s Rangeland Monitoring Network seeks to preserve the ecological value of rangelands and recommend conservation actions that enhance their function for people and wildlife. To accomplish this it seeks to understand and measure ecological function of rangelands and increase communication and collaboration among managers across California. The Rangeland Monitoring Network protocol measures three soil dynamic properties (water infiltration, bulk density, and soil carbon) and soil testure, a relative non-dynamic property. Soil texture is the only one of the four metrics that is considered non-dynamic (changes occur over millenia; not years or decades) but is an essential measurement that enable Point Blue to compare like textures. In the case of True Grass Farms home base ranch, all of the measured soil textures are sandy loam which makes comparisons between sites easier. Below is the soil textural triangle for TGF. The soil textures on the the locations on your farm are noted with red dots. The grey dots are values for other RMN ranches in Marin County.

Here is a breakdown of the various monitoring steps, for more in-depth information see the Handbook of Field Methods:
Point Count Locations
Point Count locations for the RMN are identified using the Generalized Random Tesselation Stratified (GRTS) approach. GRTS is a commonly used and useful tool for selecting a set of spatially-balanced and random samples.
Soil sampling will occur within a 50 m radius of point count locations. At each point count location identified for soil data collection, sampling sites will be randomly identified and a minimum of 5 water infiltration, 5 bulk density and 5 soil carbon samples will be taken.
Additional samples will be taken as time allows. Soil carbon samples will be bulked, mixed, and resampled on-site such that 1 sample will result from each location but it will represent an aggregate of the area within 50 m of the sample location.
Water infiltration
Helps inform us about our soil’s ability to capture rainfall. More infiltration would imply better soil texture, good soil fertility and ground cover.
Single ring infiltrometer – 15.2 cm diameter, 15.2 cm depth
Clear plastic or glass water bottle, with 450 mL volume delineated
Time the infiltration rate (max 45 min)

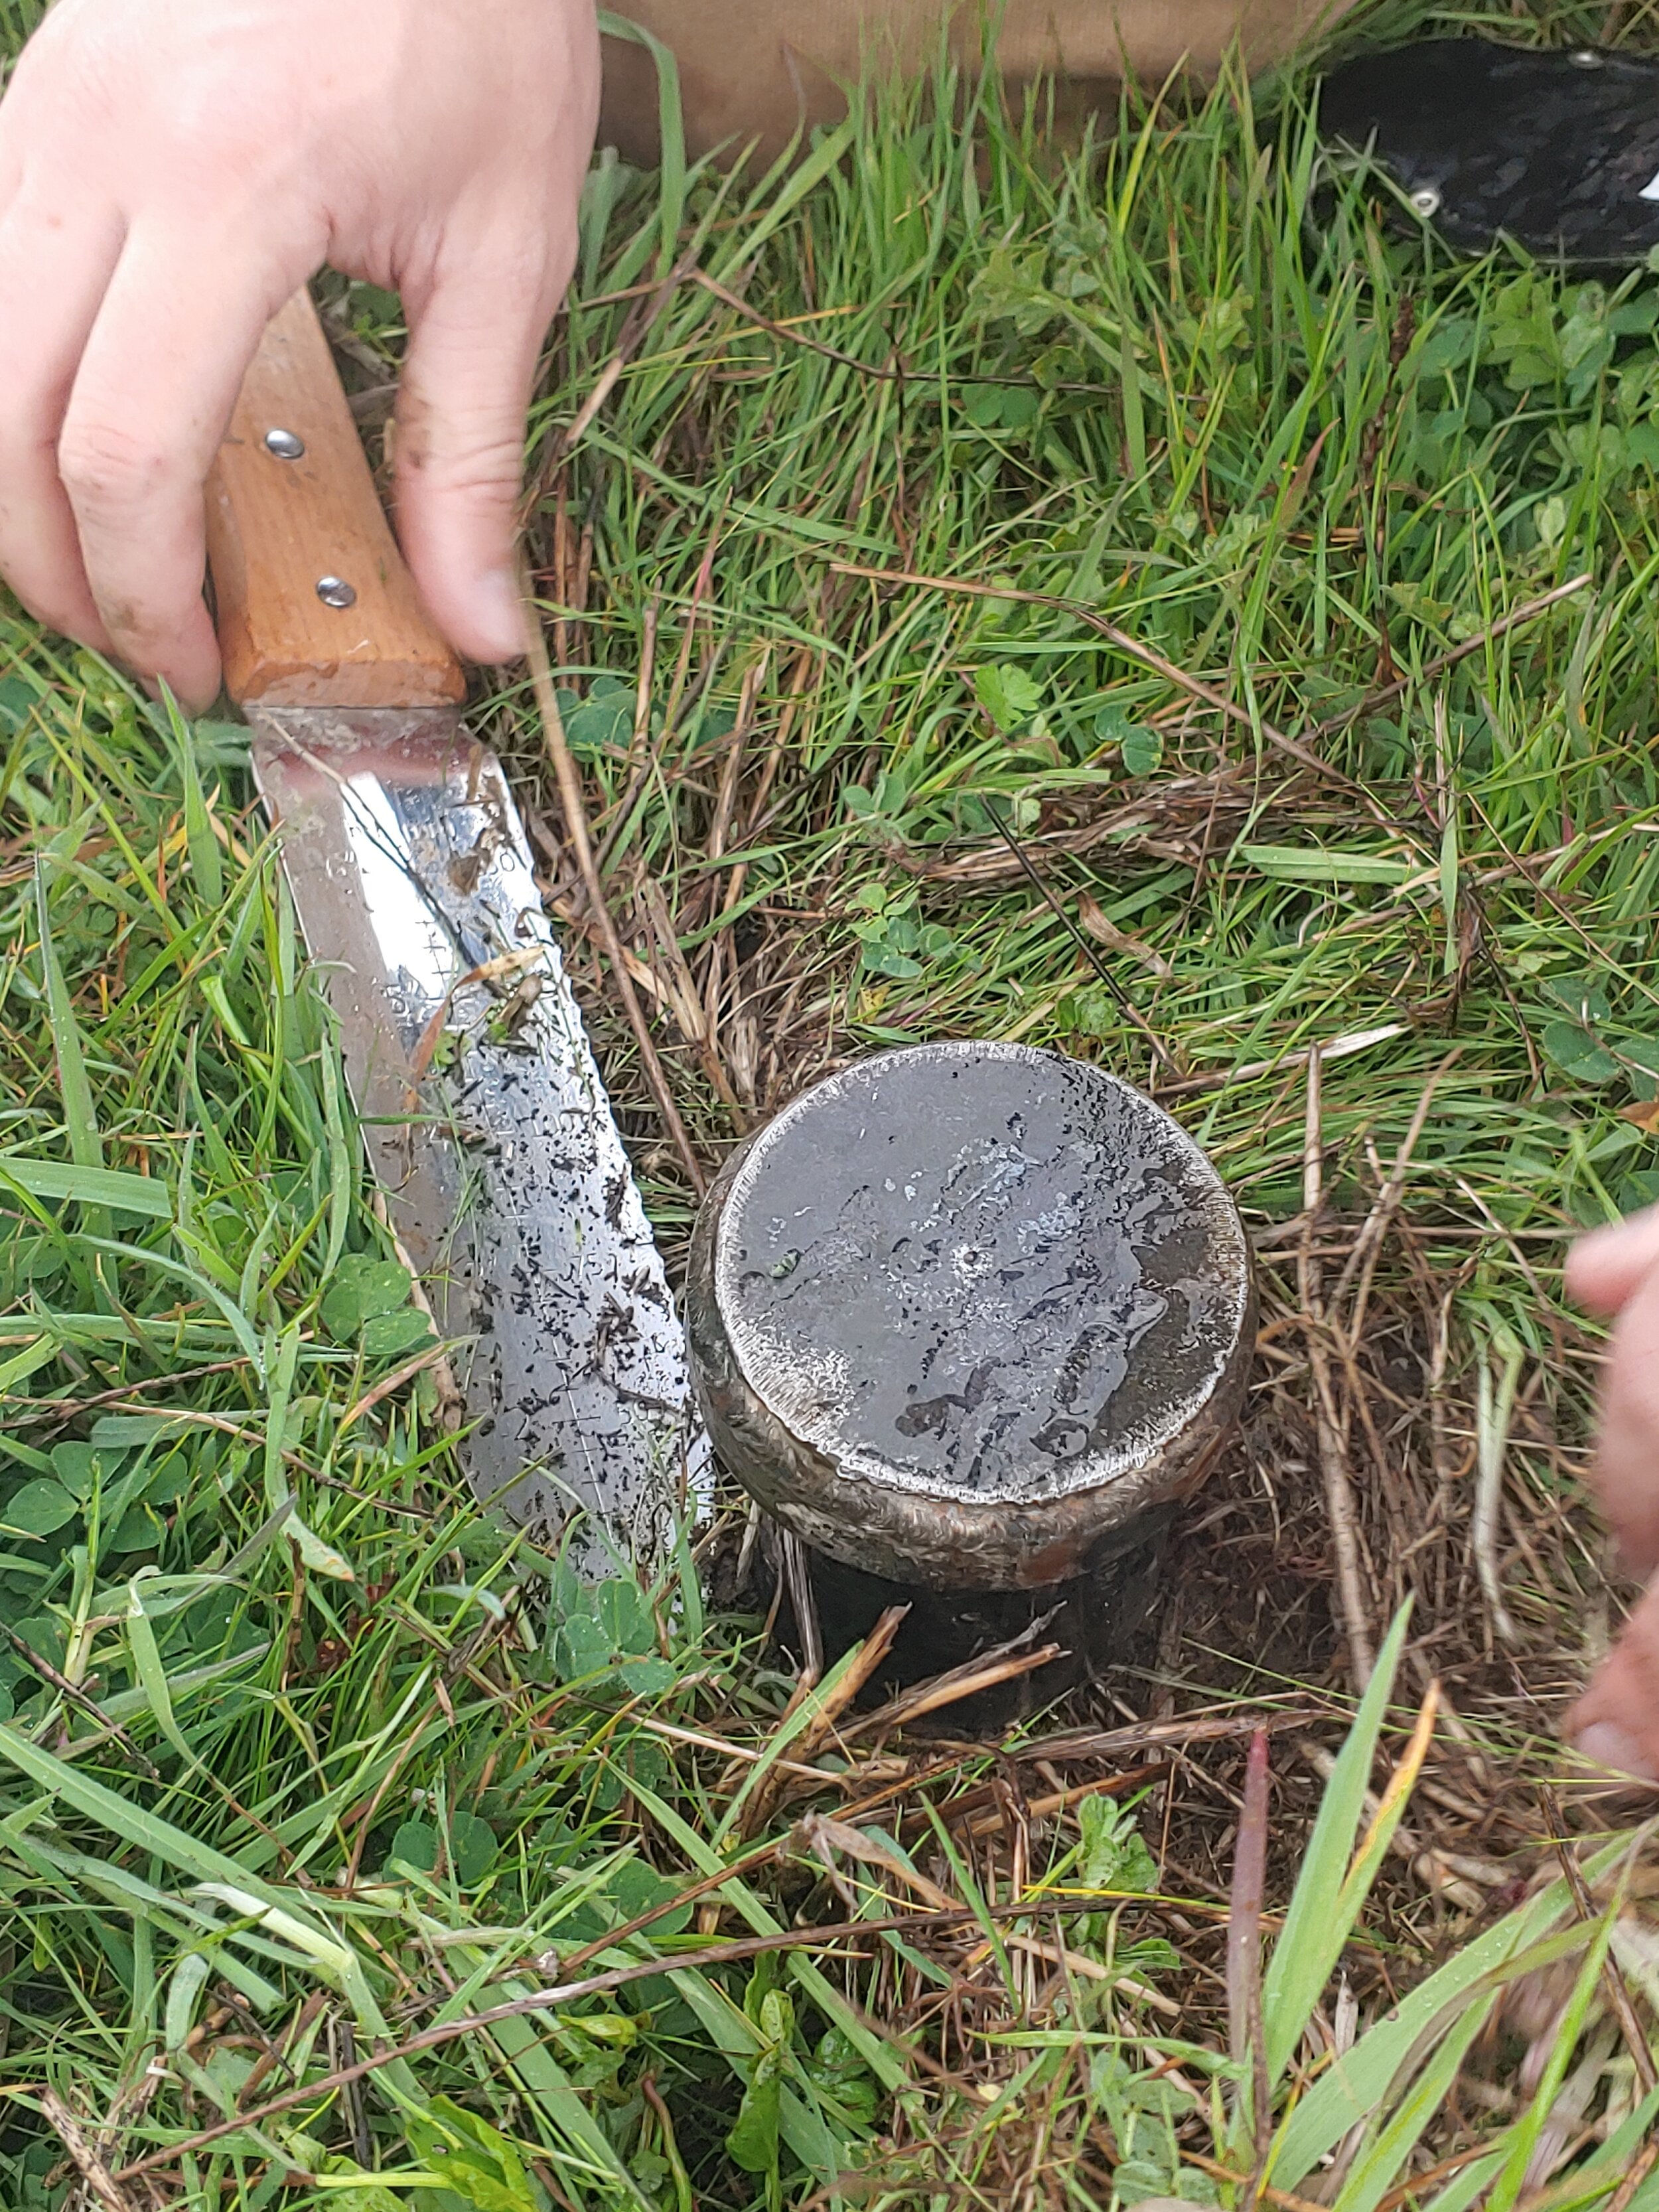
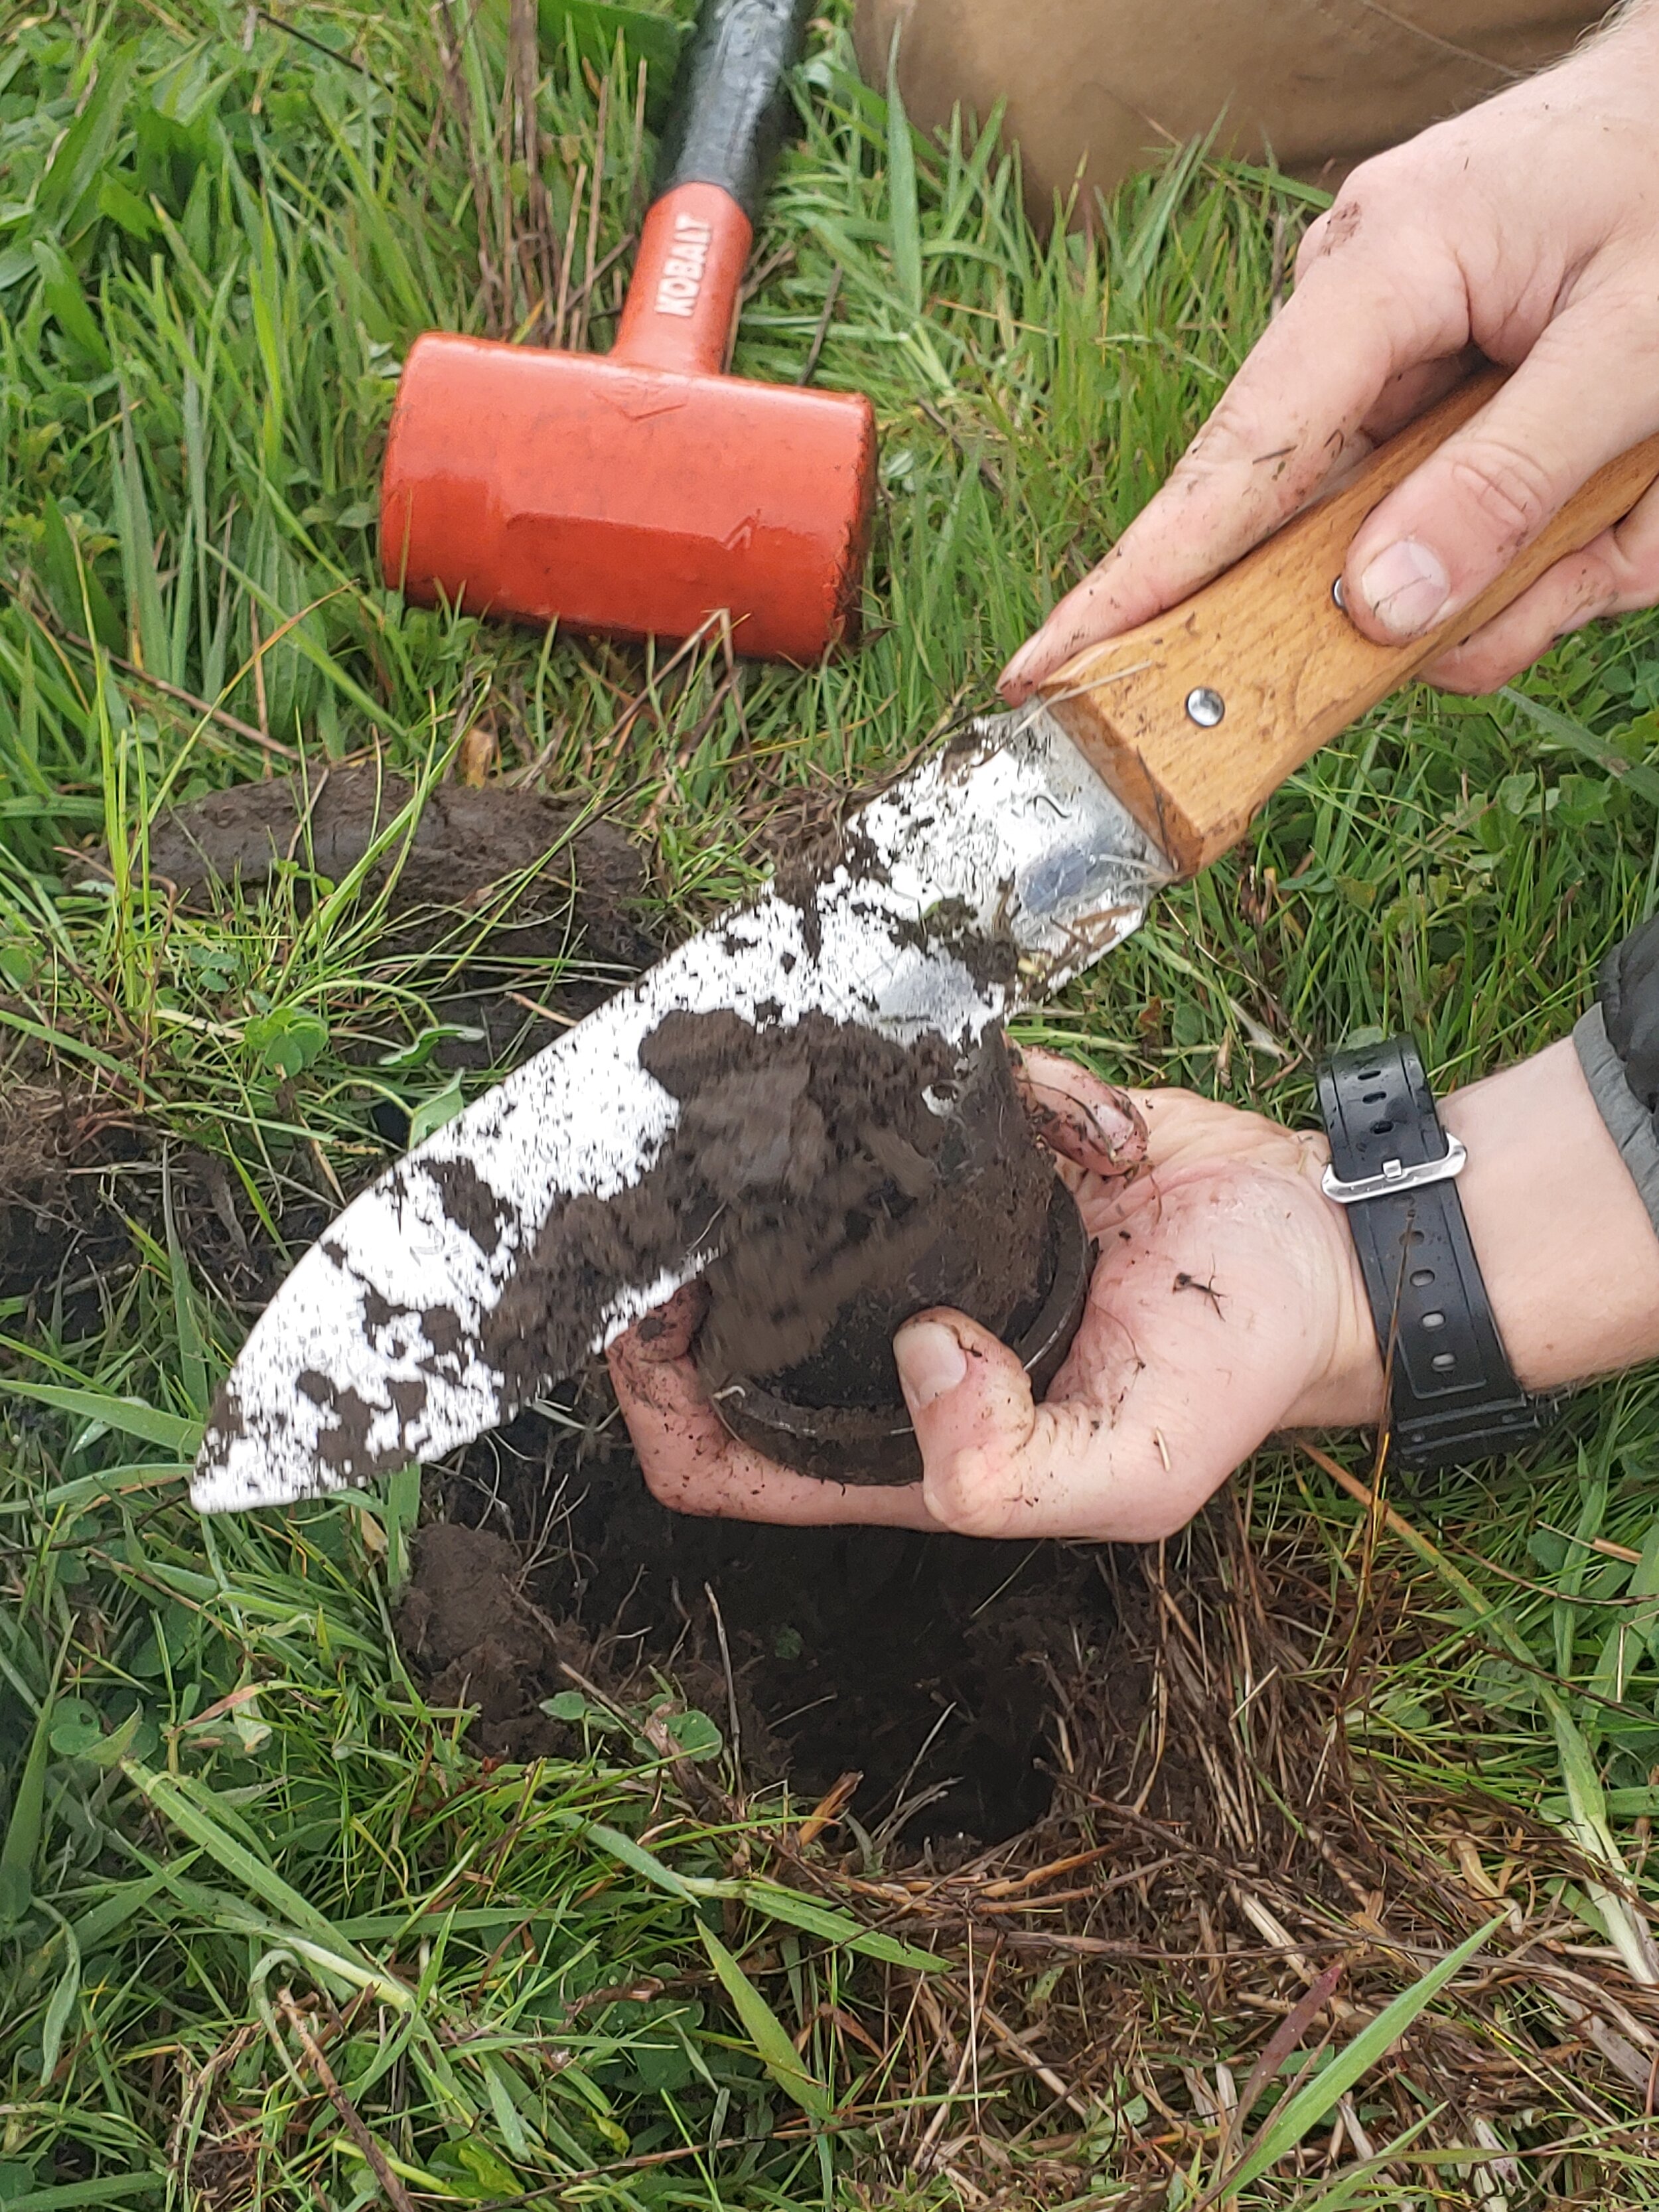
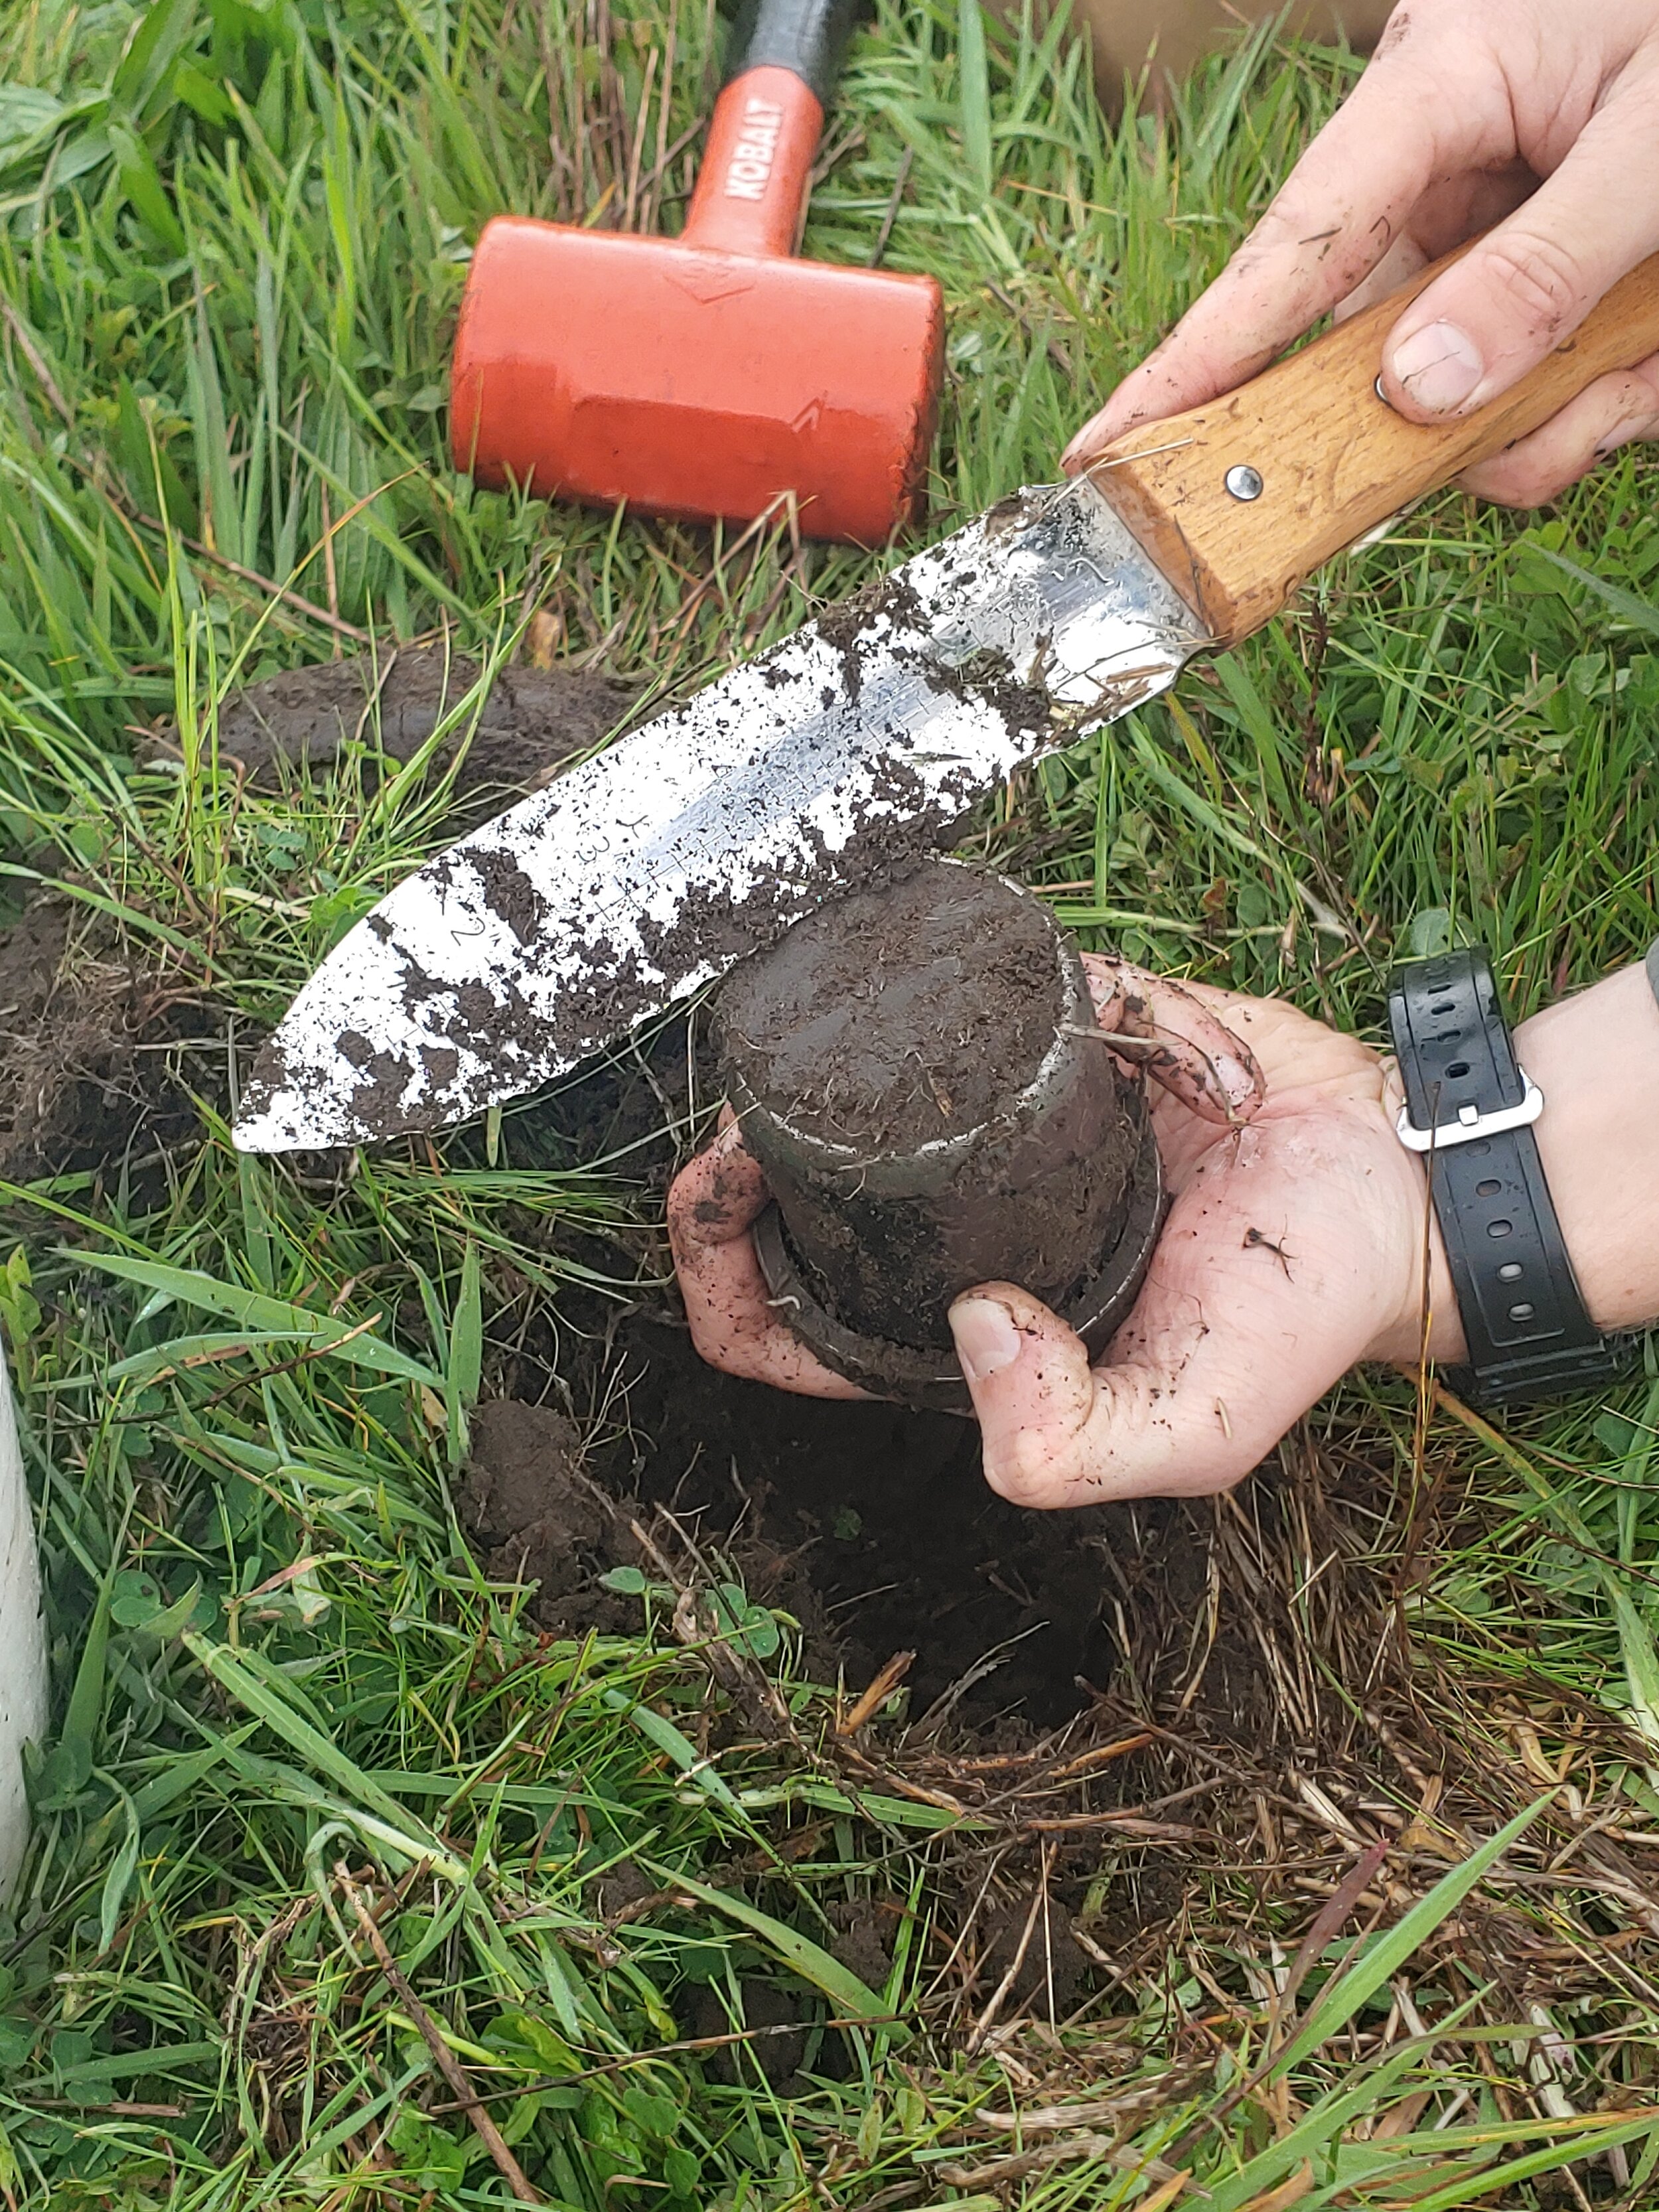

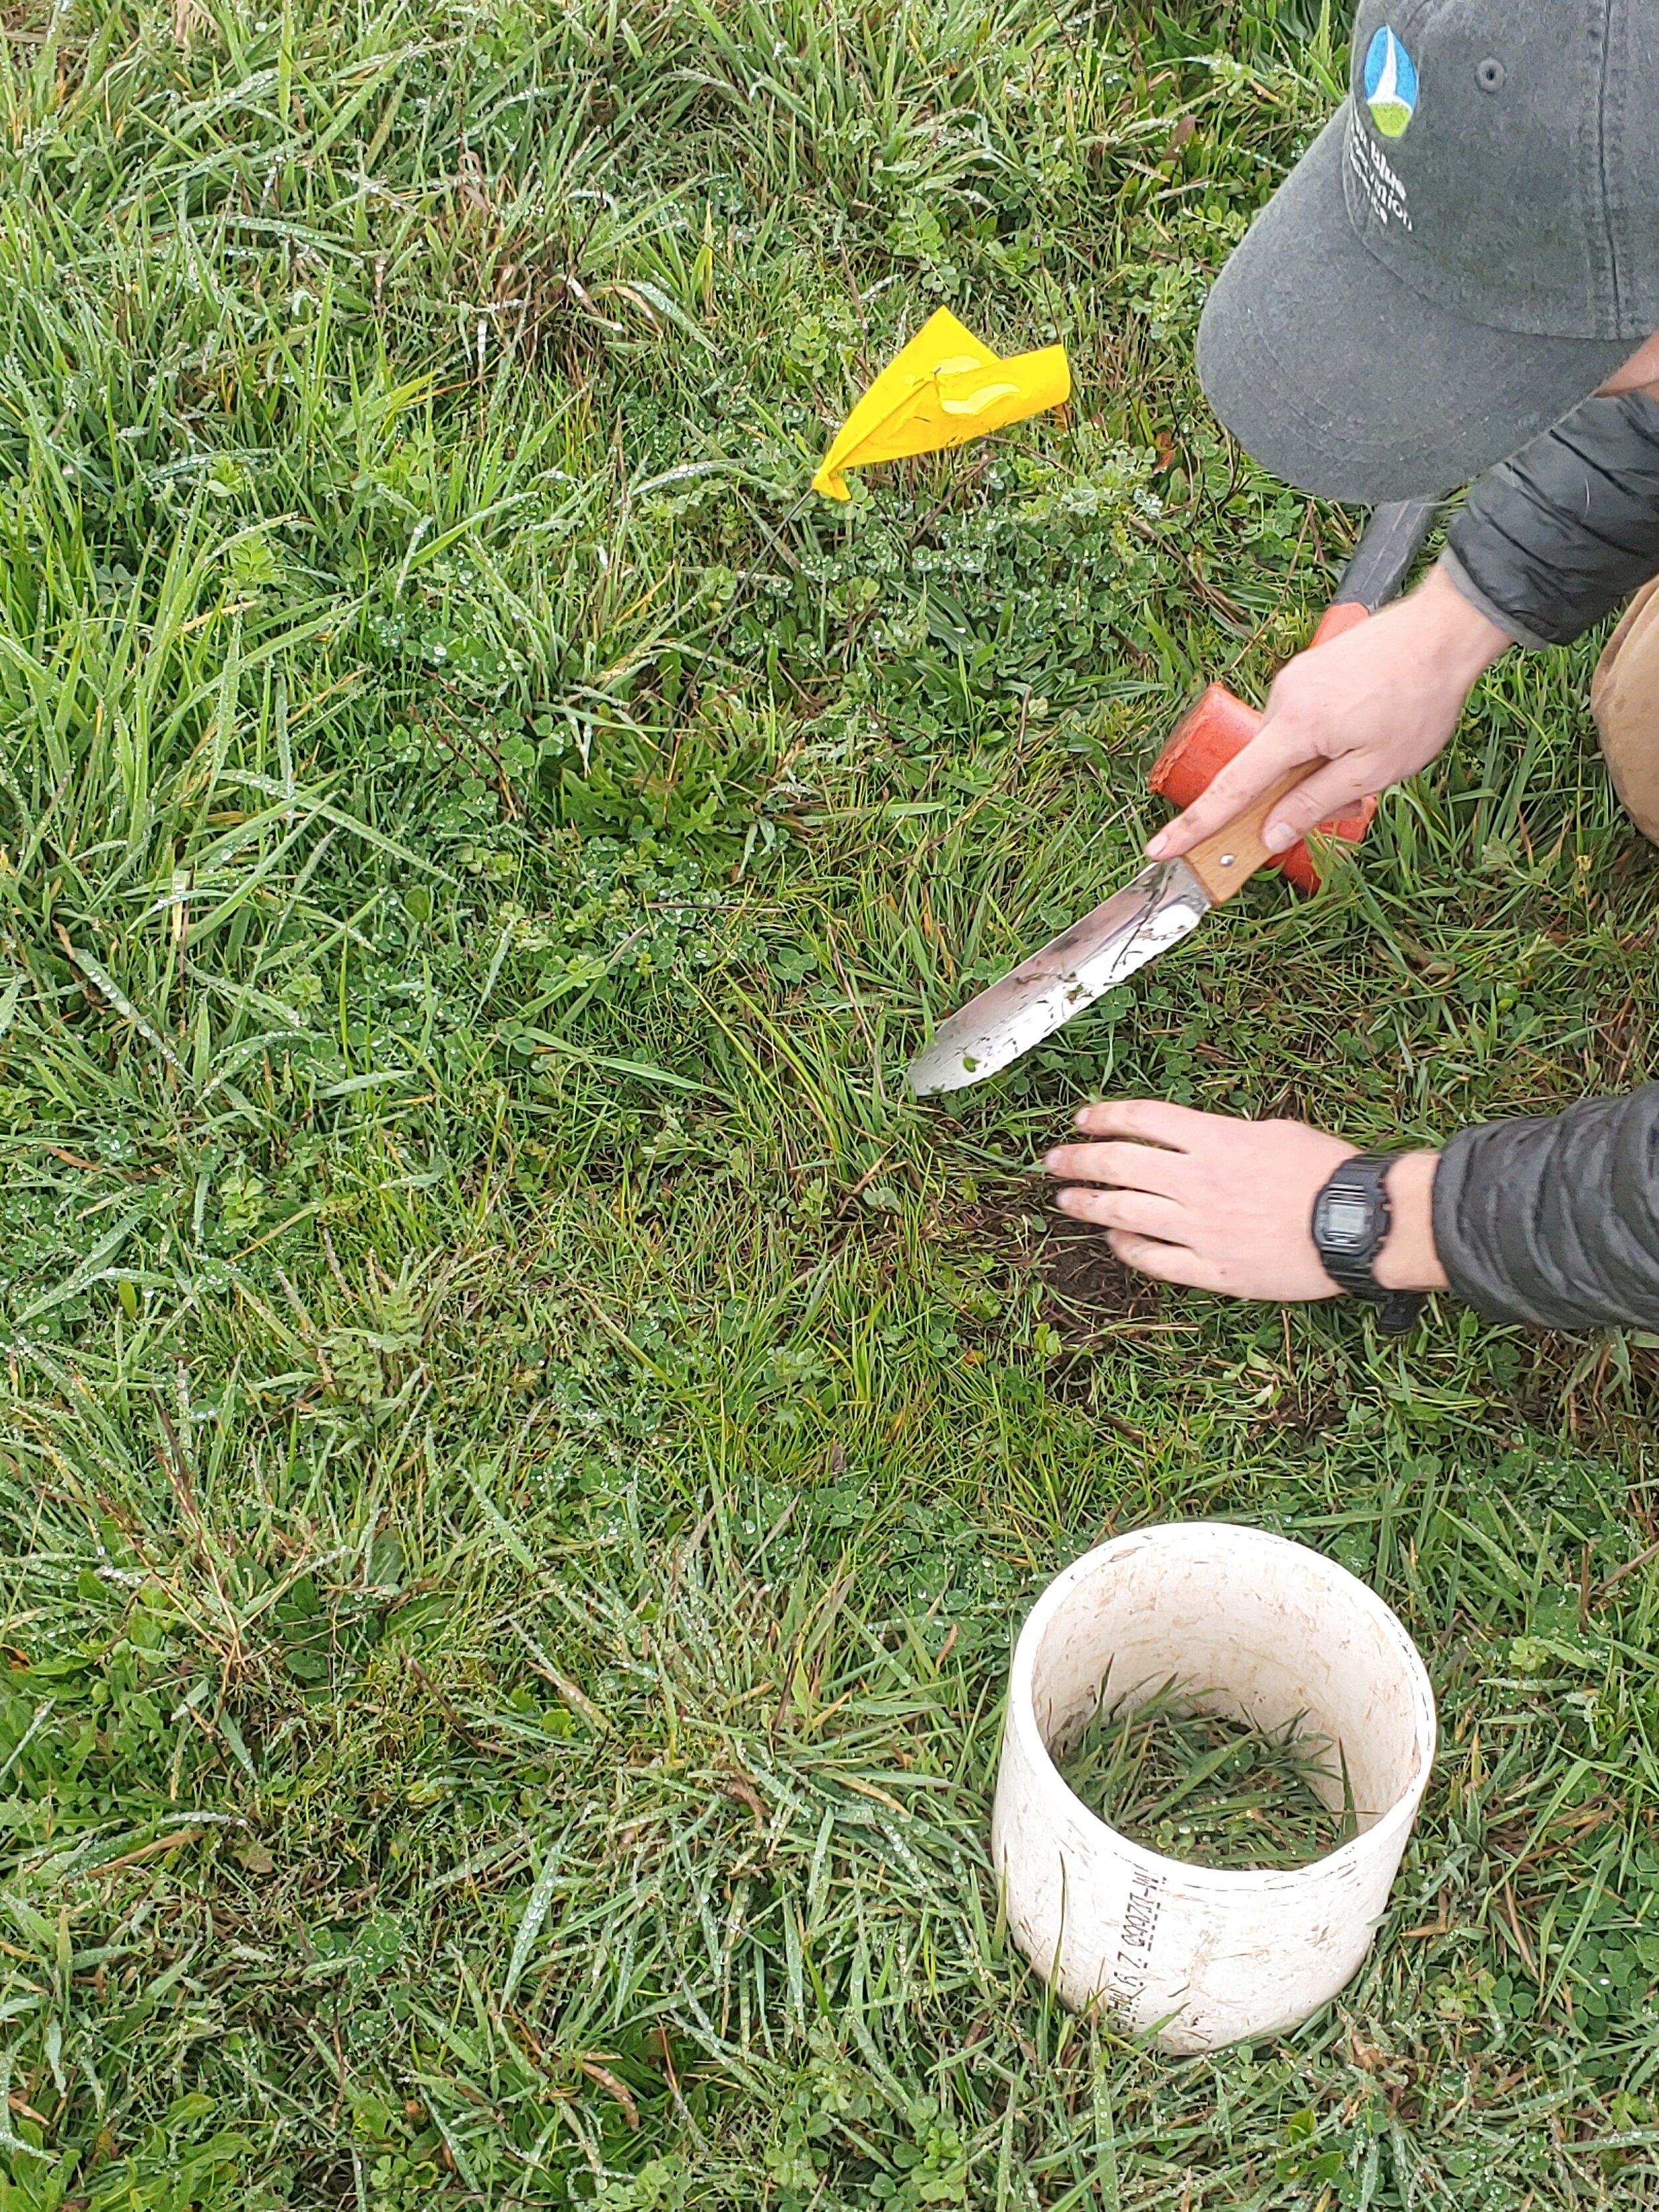
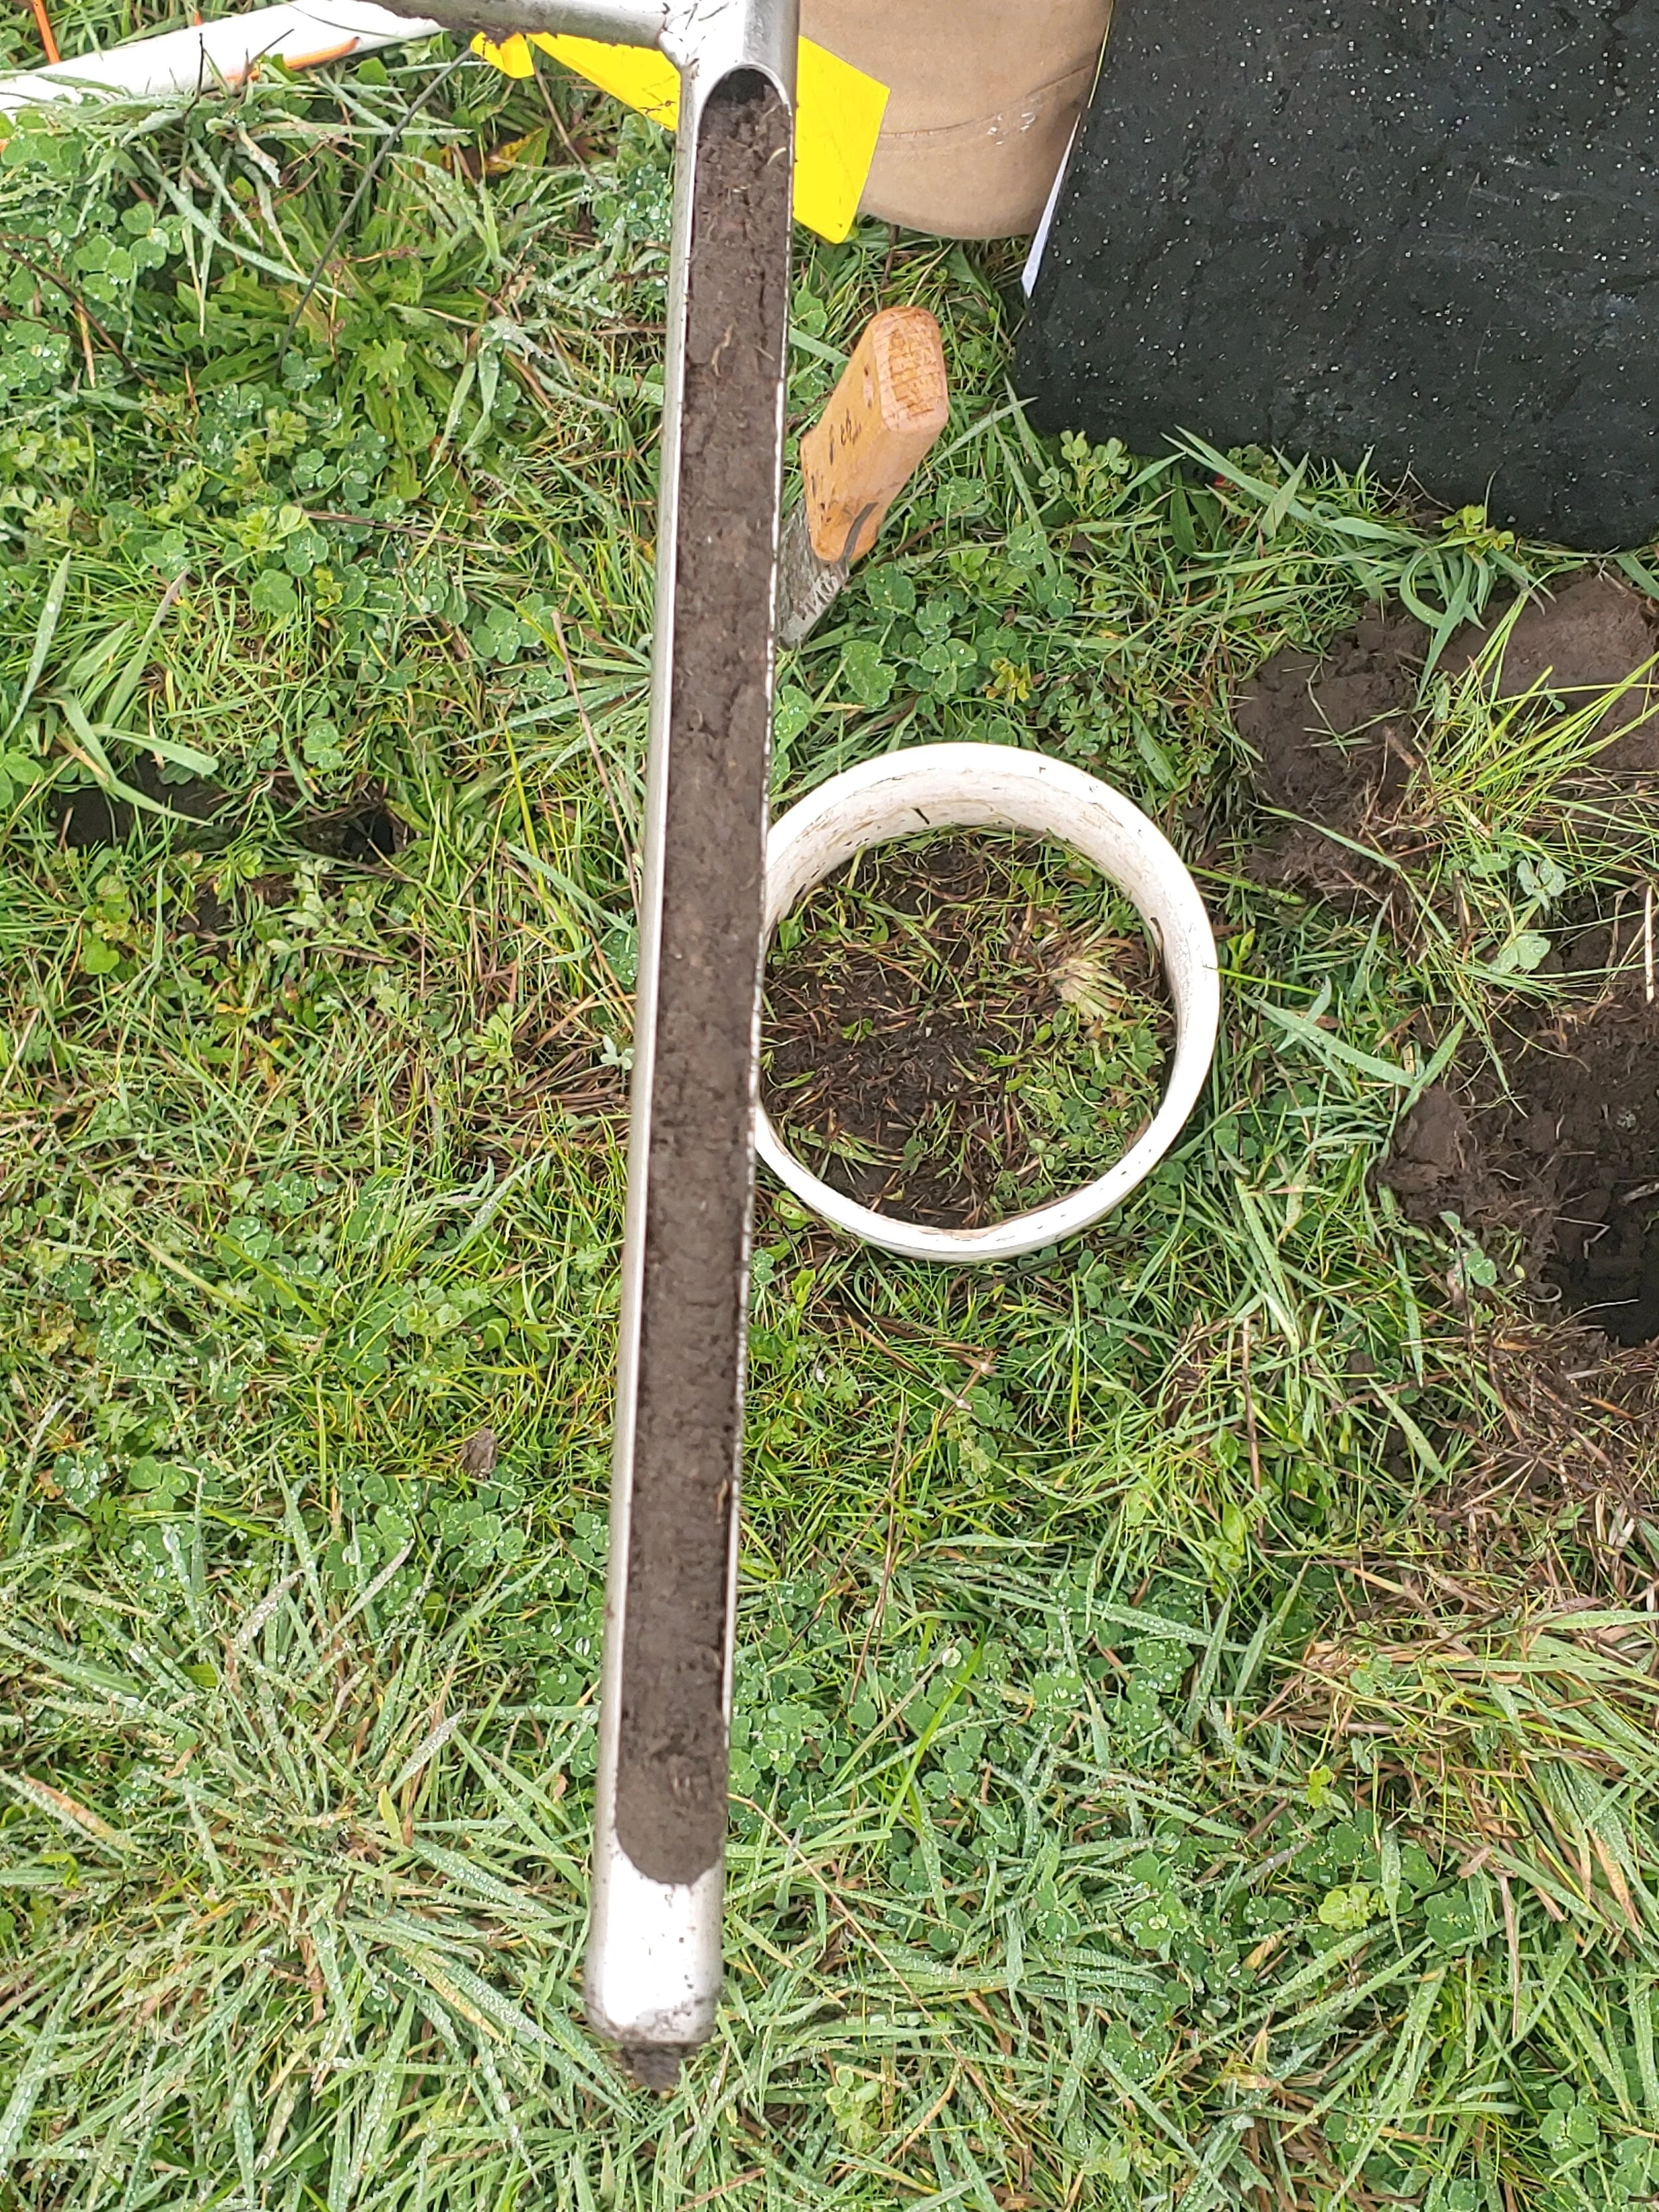
Soil Bulk Density
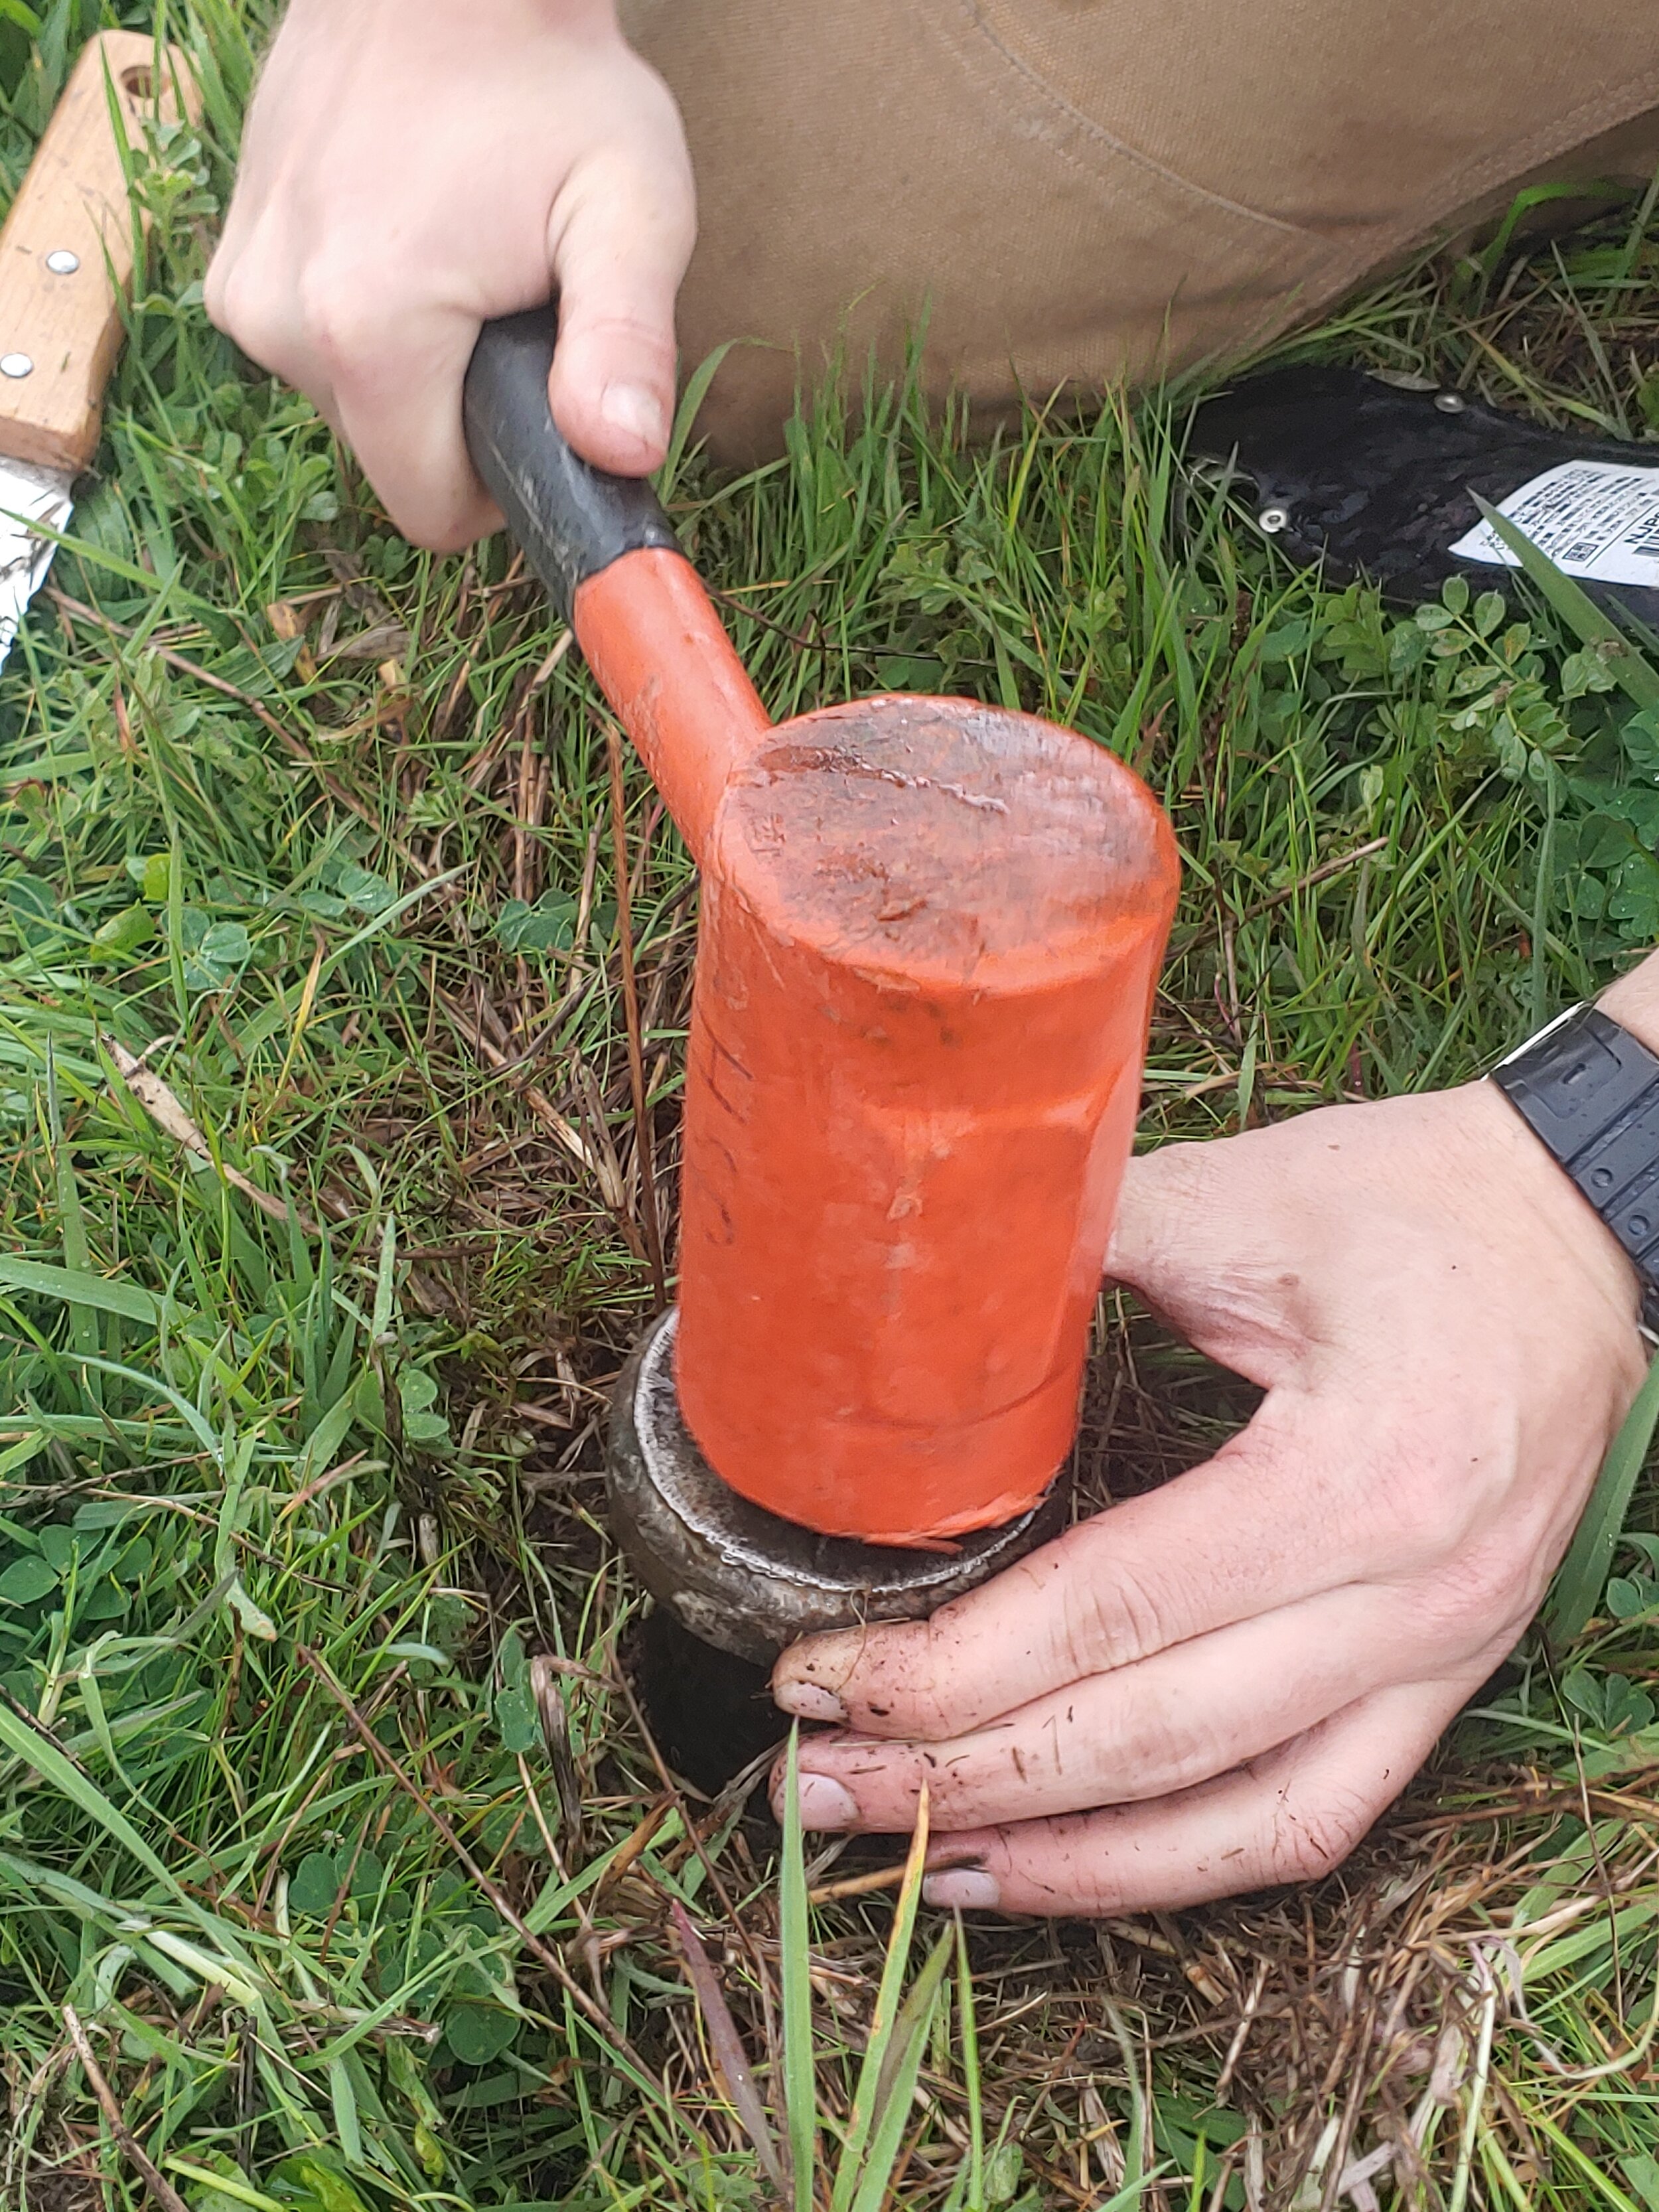
Insert ring (5.1 cm diameter, 7.5 cm high) until top of ring is level with surface.
Be careful to apply even pressure. Use wooden block and hand sledge if necessary.
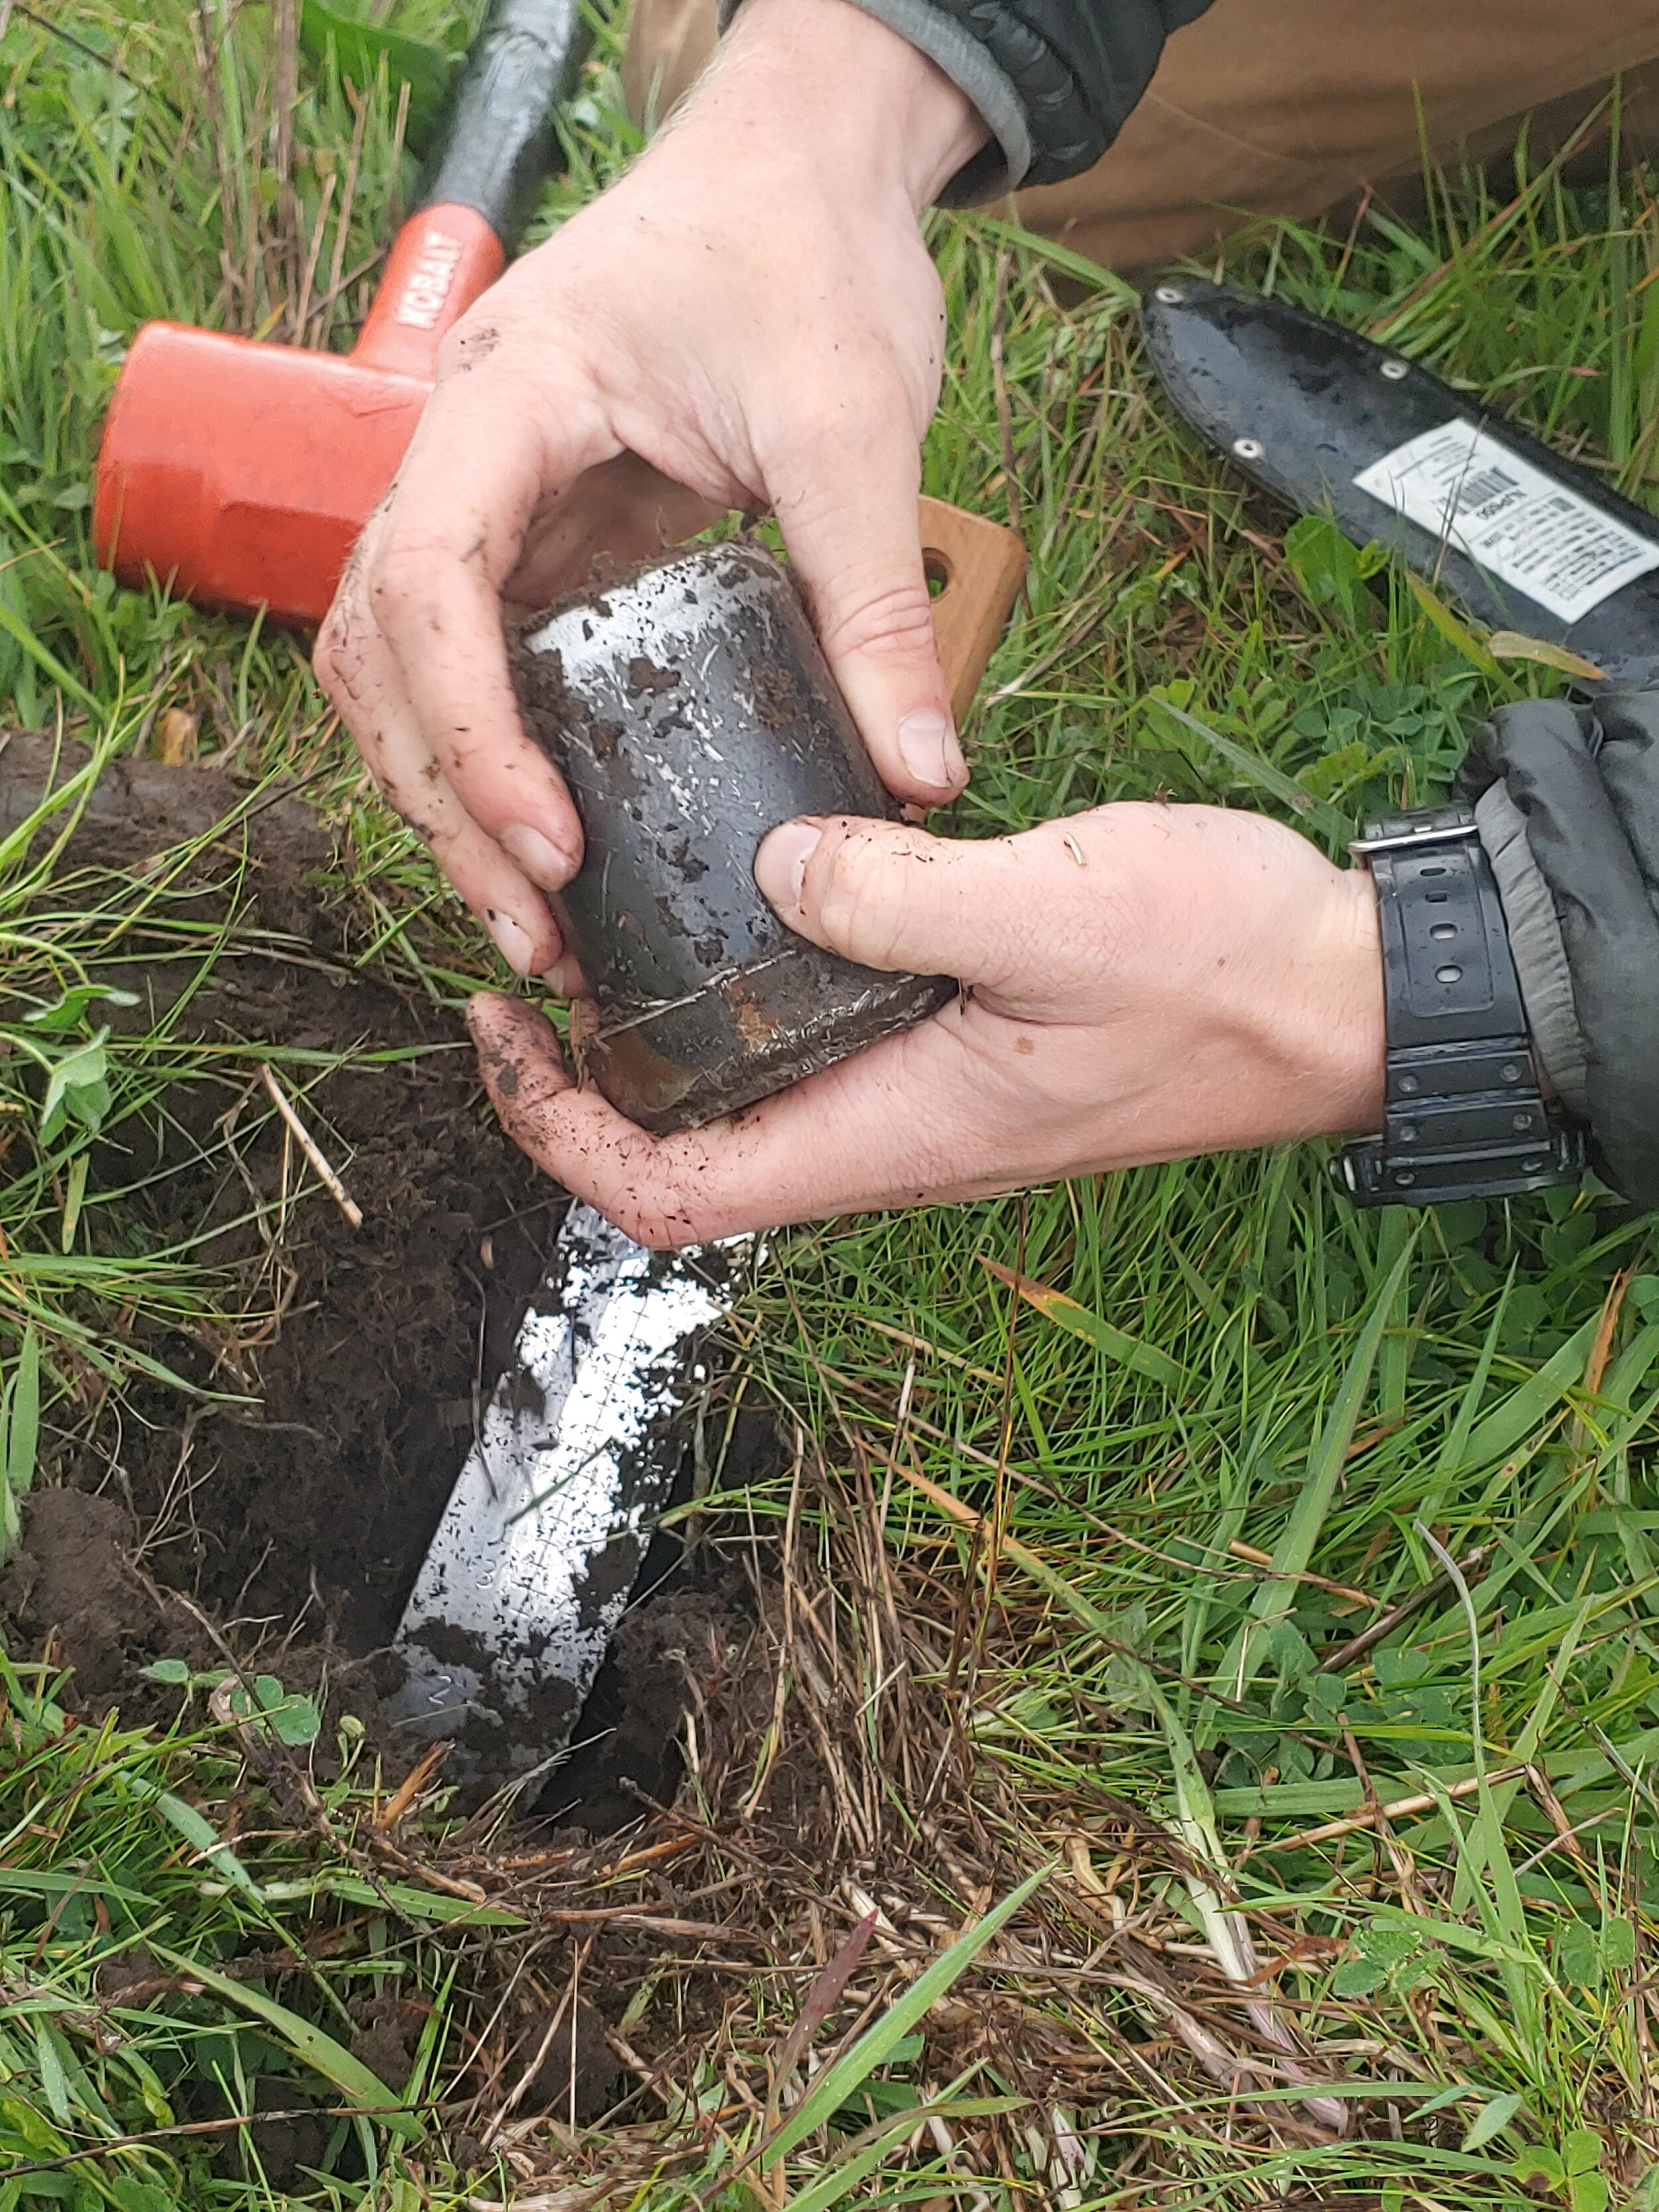
Excavate ring using trowel. Lift ring out using trowel underneath it to ensure no loss of soil.
Use flat blade knife to level soil with bottom of ring.
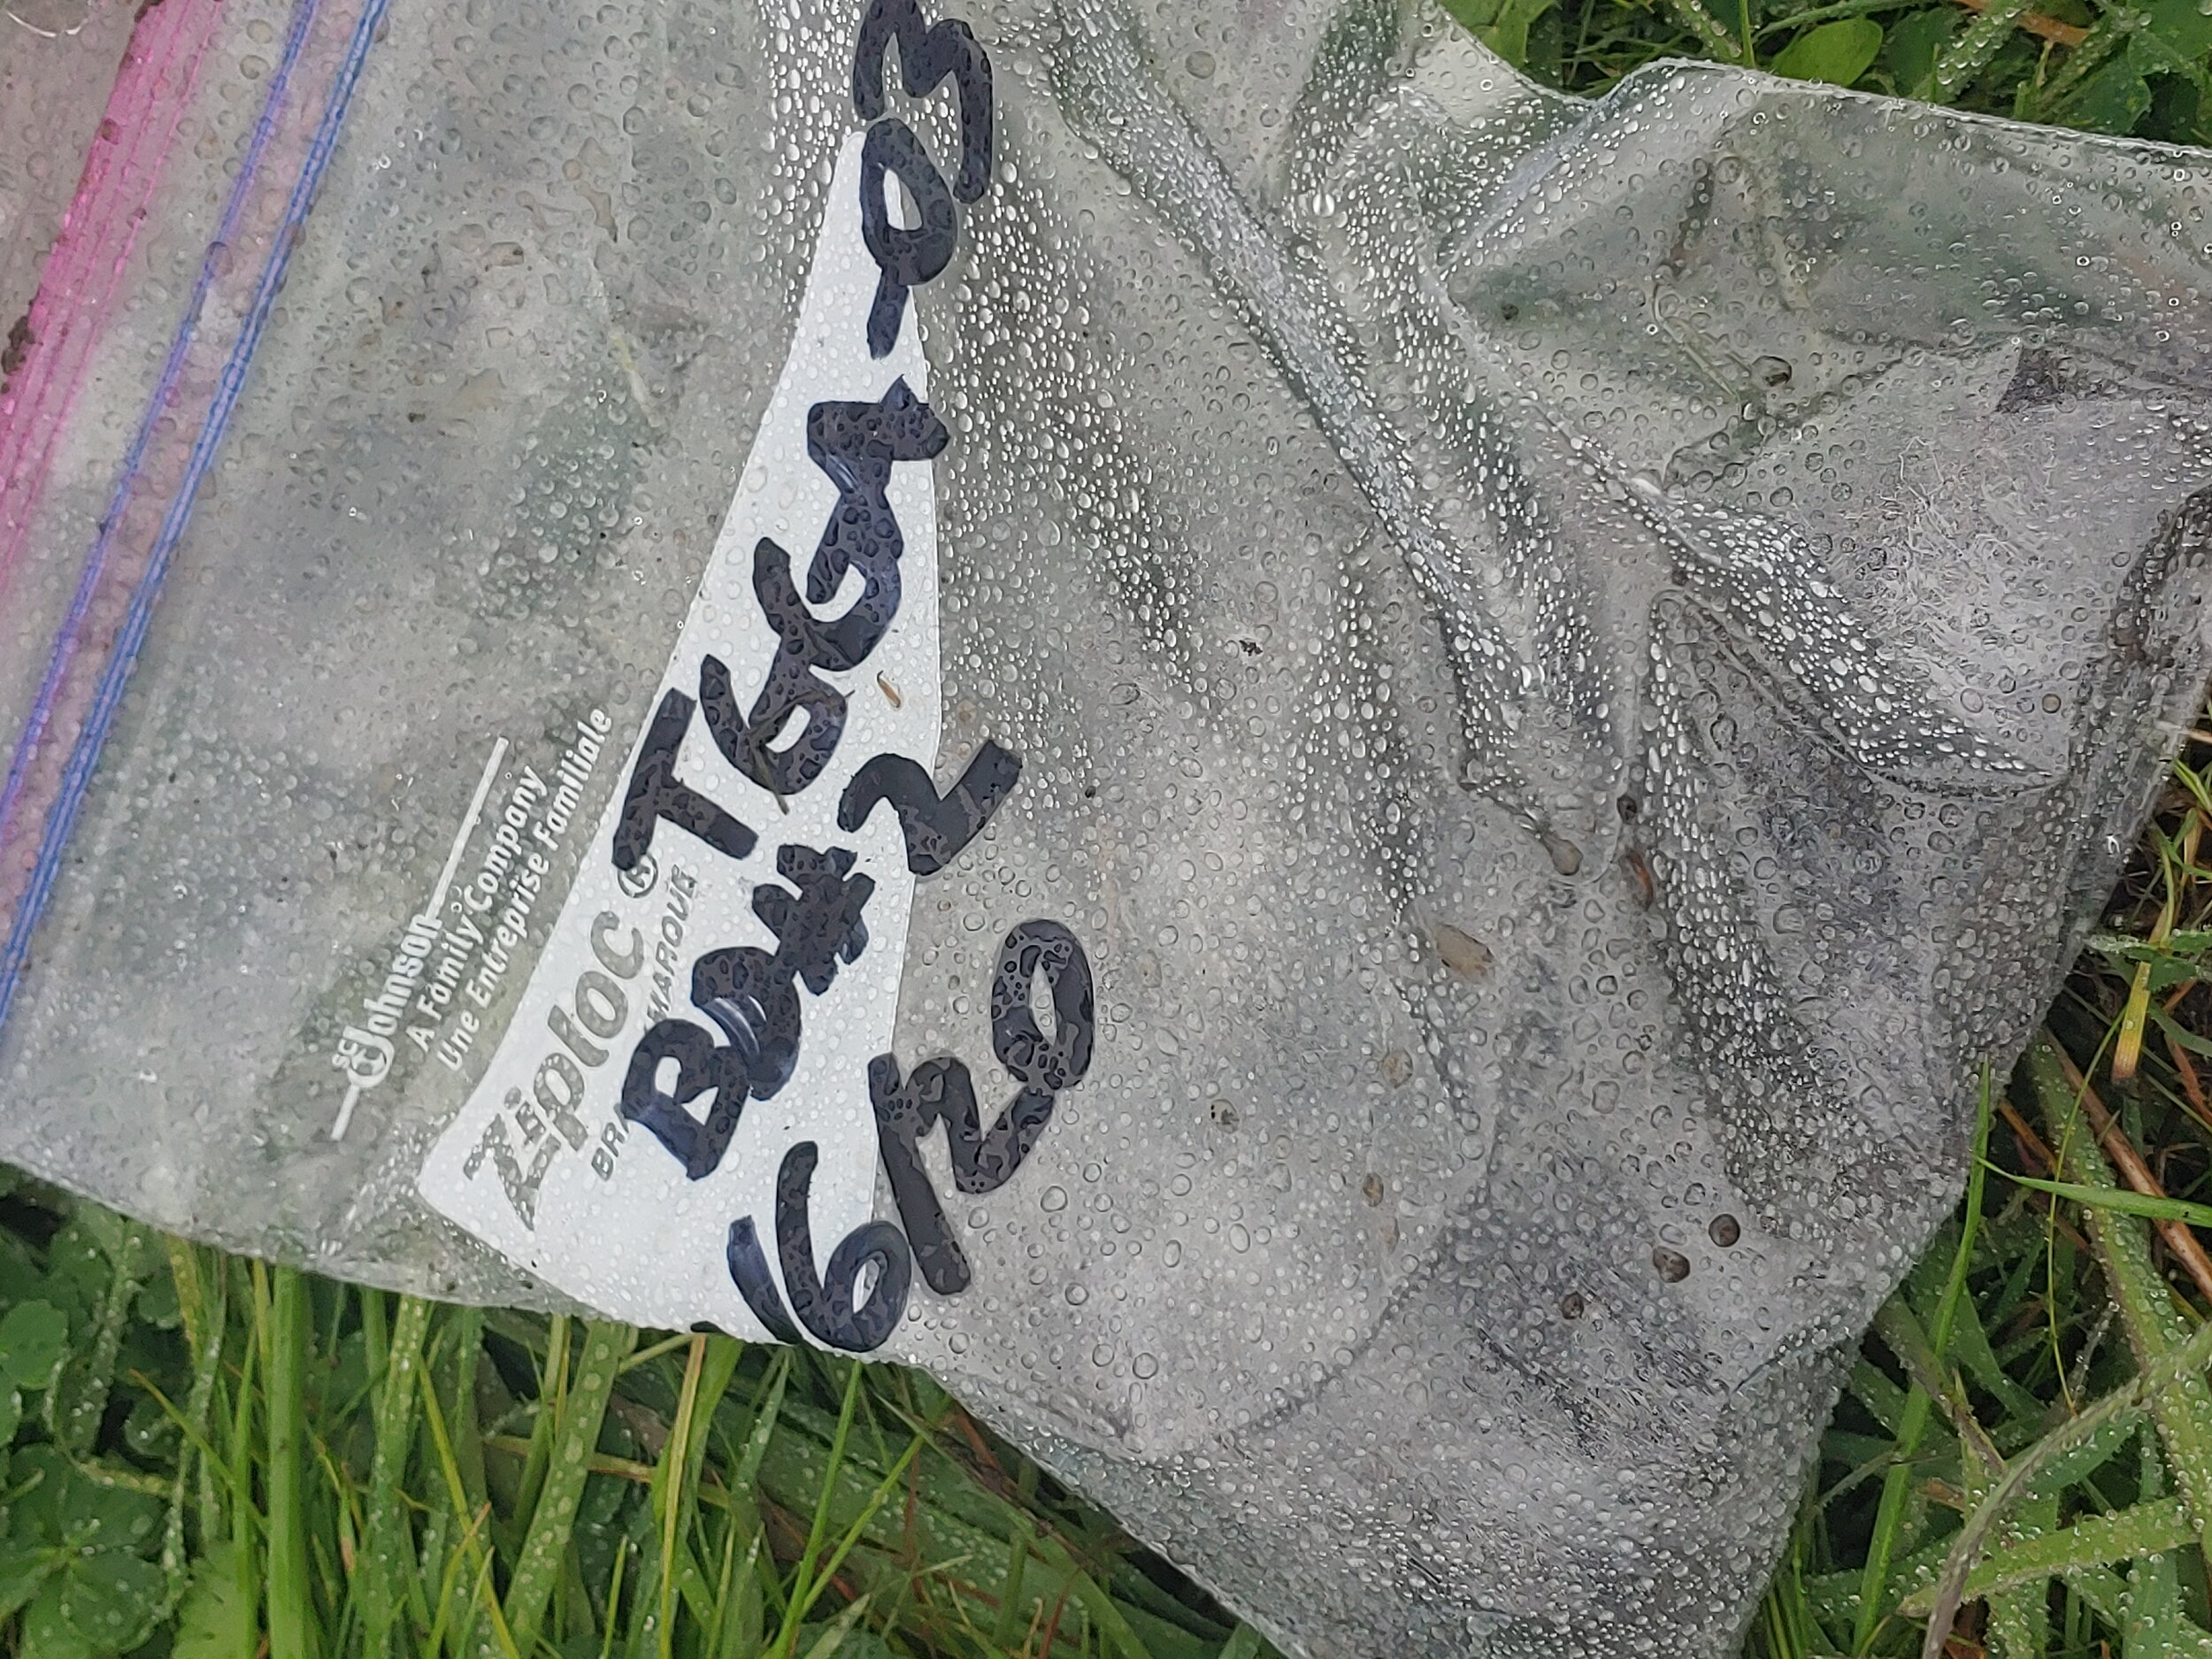
Place soil in sampling bag and label with the ranch code, point count location, the sampling site number, and date.
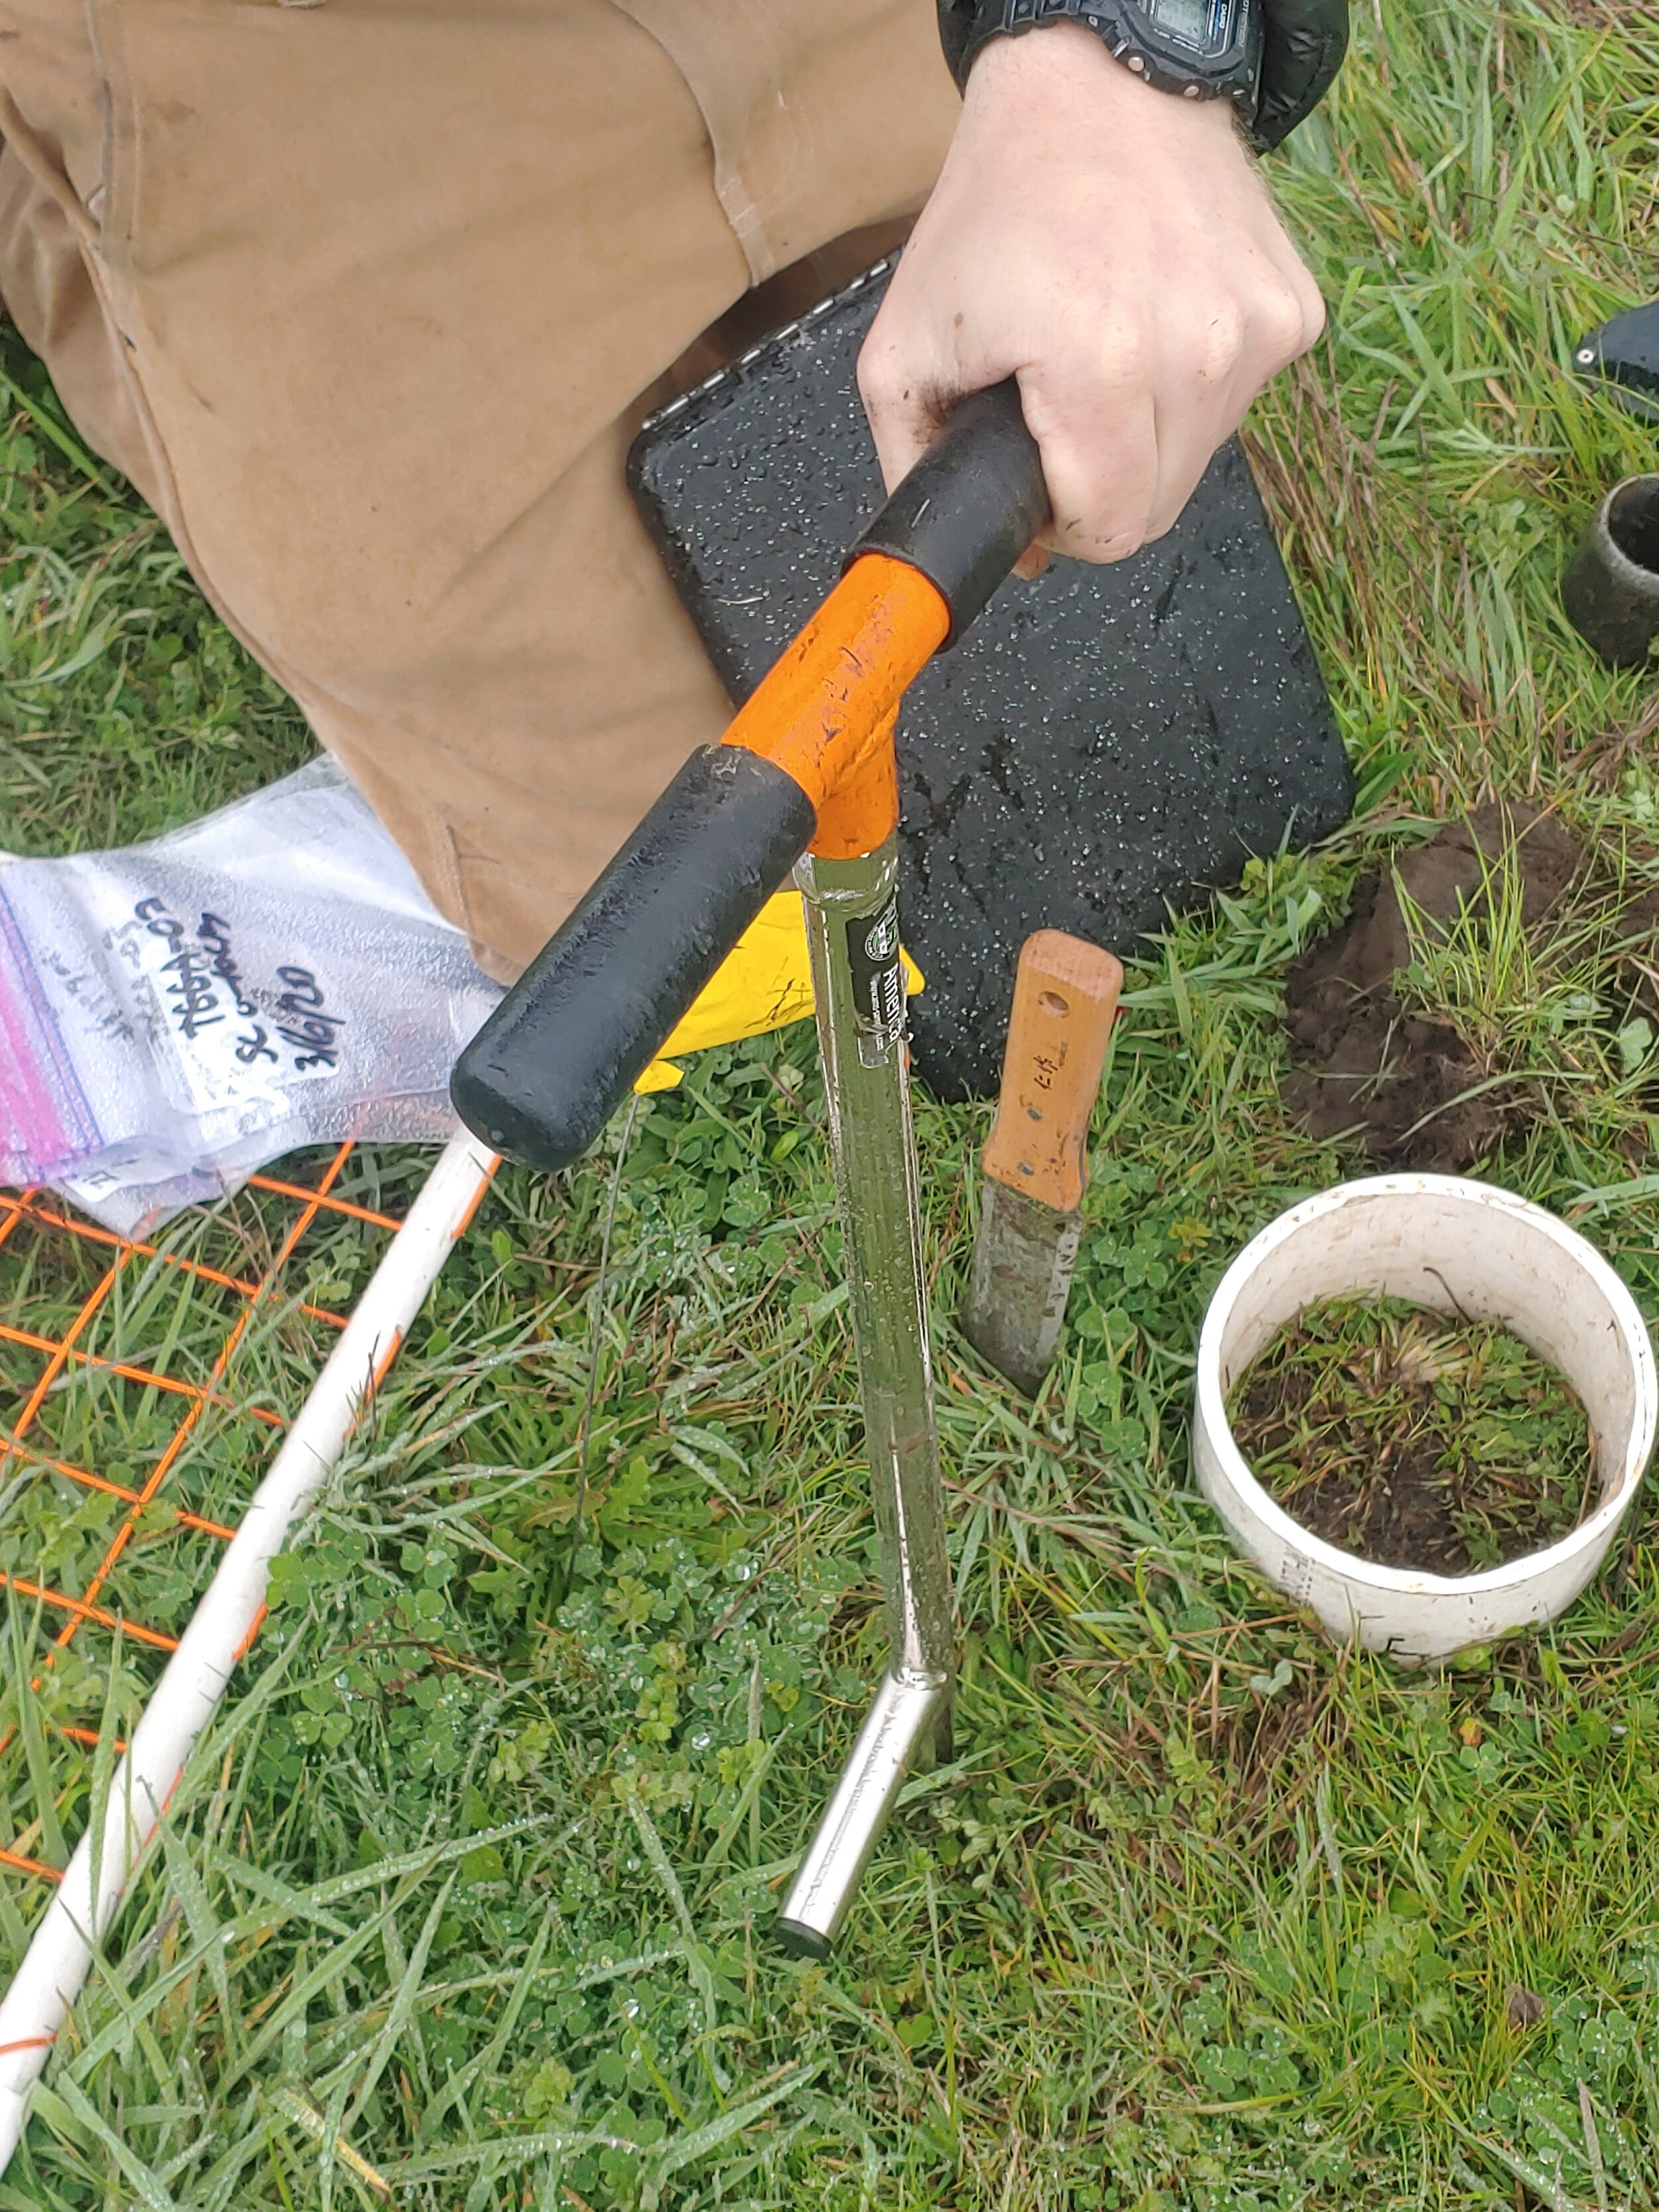
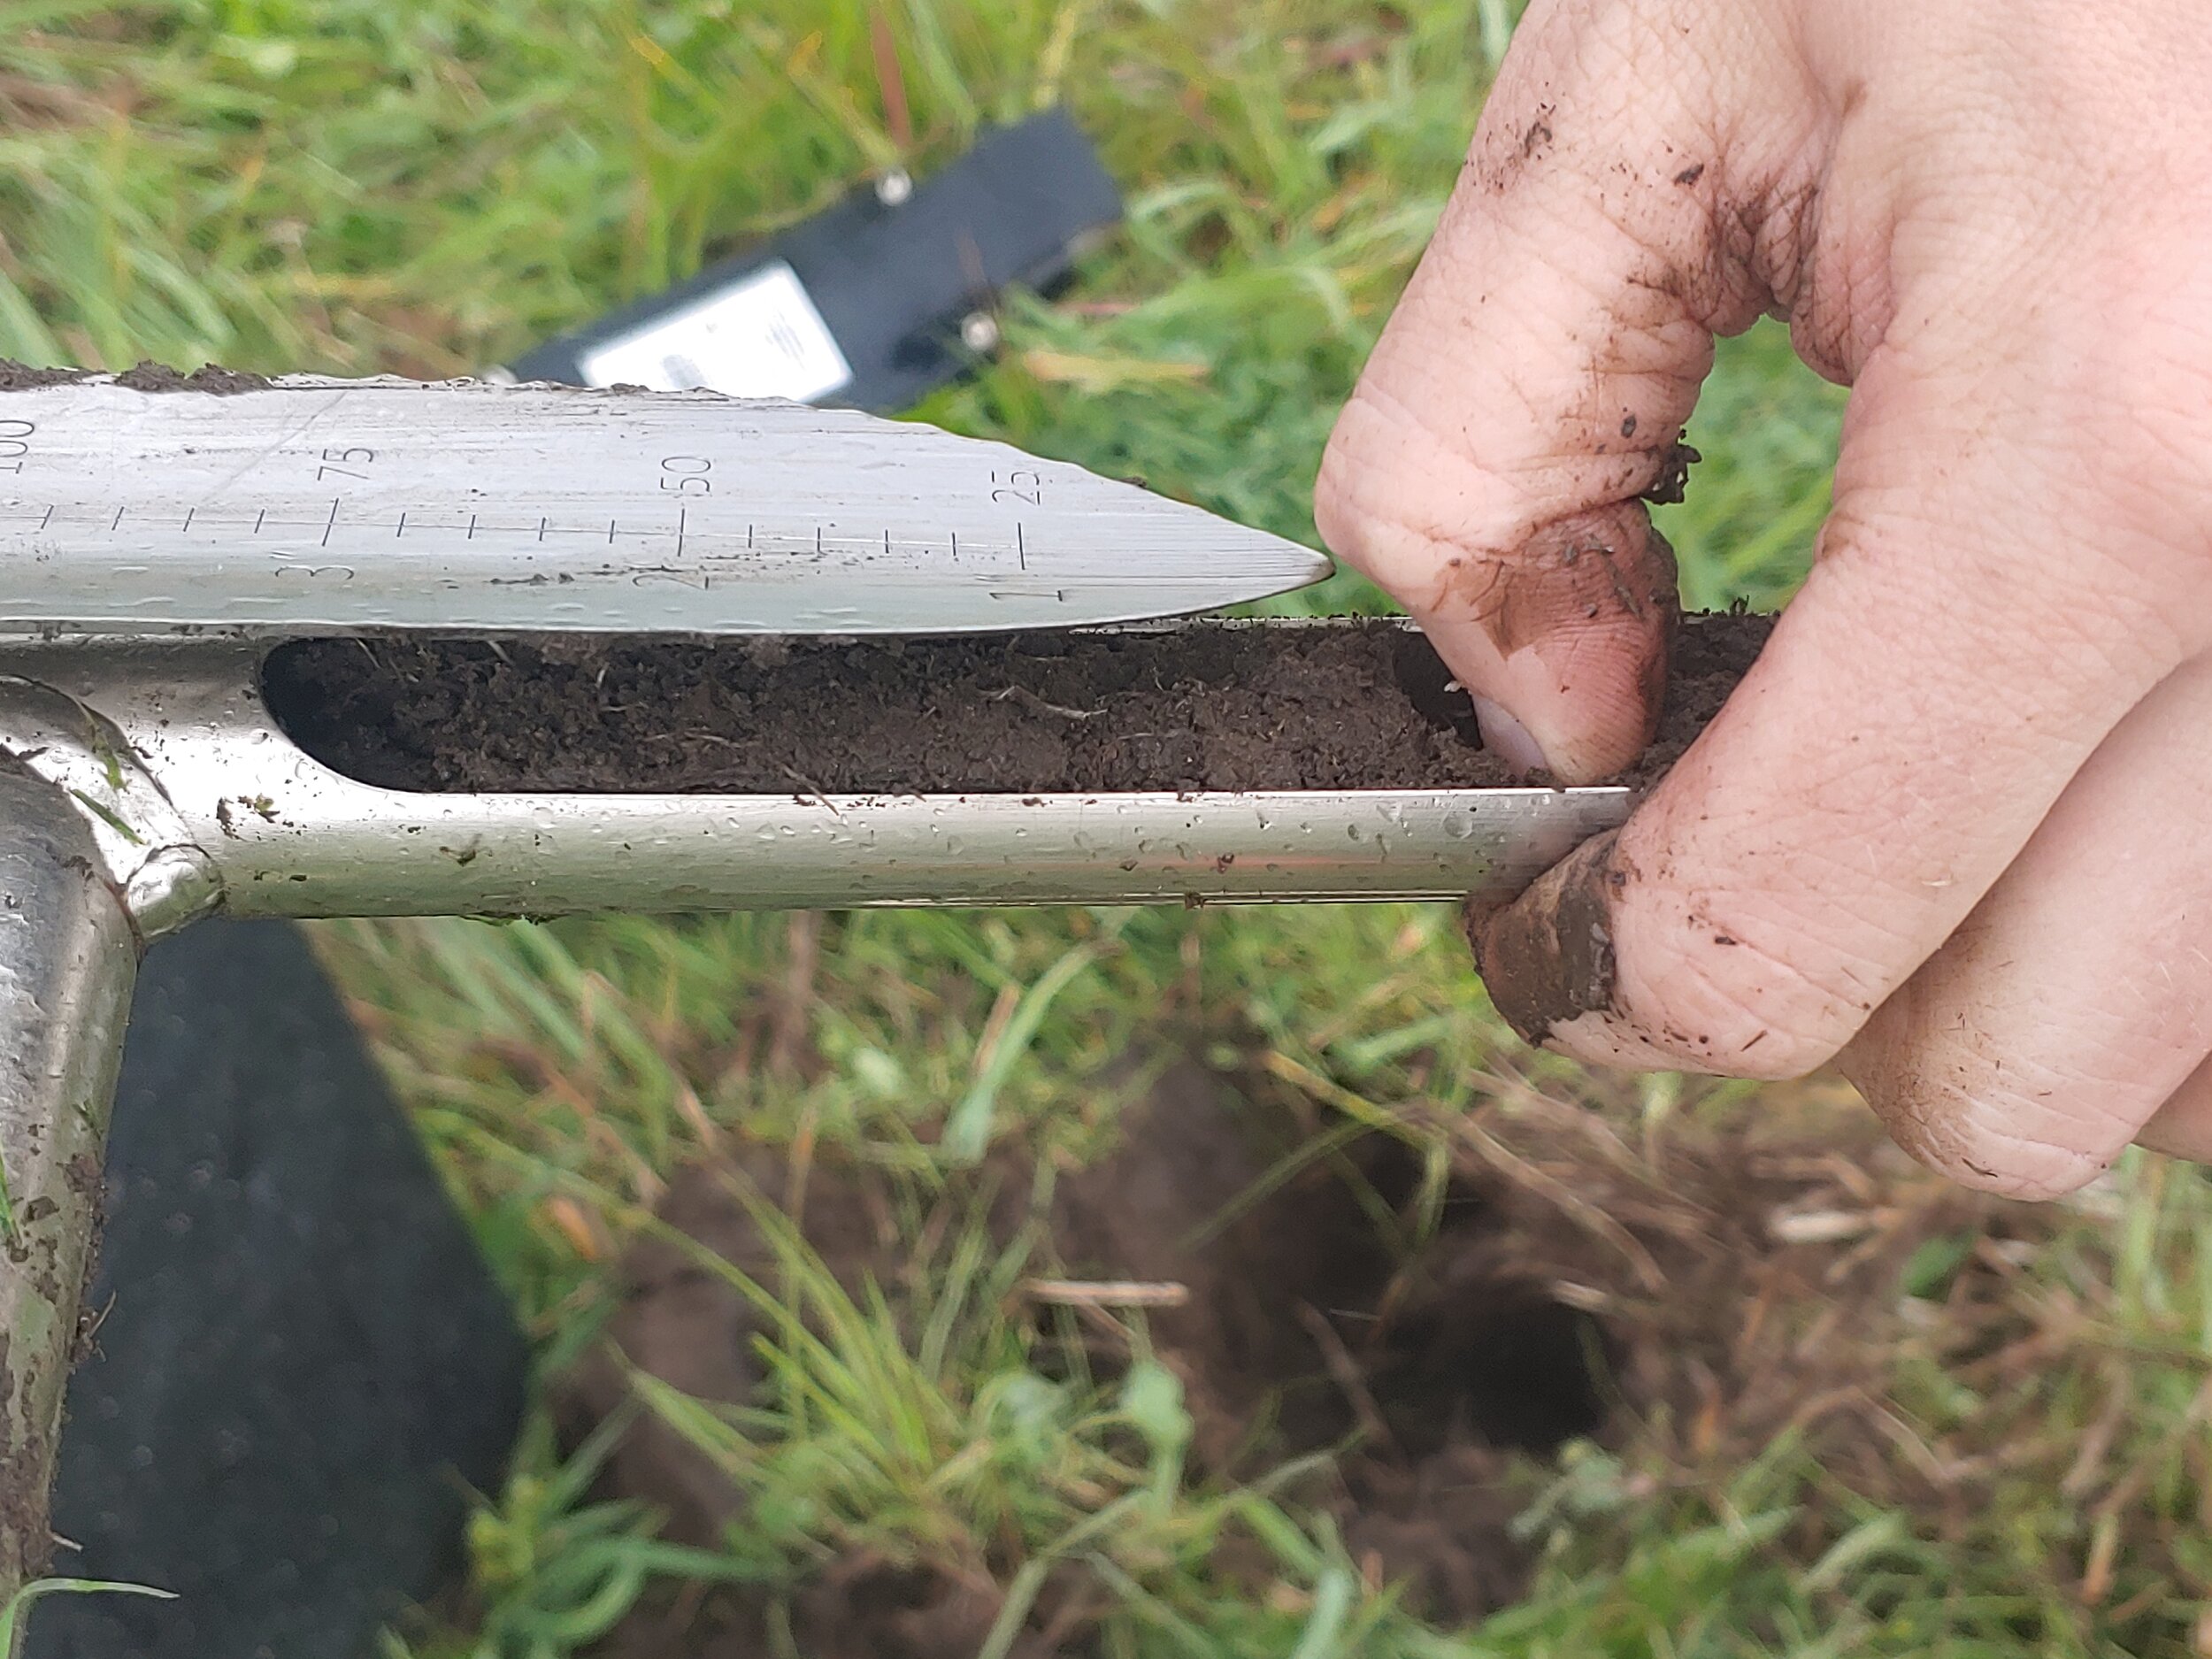
Soil Sampling
Point Blue recommend measuring organic soil carbon with the dry combustion method. Dry combustion involves heating the sample up to about 900°C and measuring the combusted CO2 via gas chromatography. remove the surface soil, or disturb soil crust.
Using soil probe, take soil sample to 10 cm. Take a couple of samples at each subsample site because you will need at least 100 g of soil per sample site for soil carbon analysis and 300-400 g for carbon and particle analysis.
Repeat the process for the 10-40 cm depth.
Keep samples from 0-10 cm and 10-40 cm in separate buckets.

Vegetation Monitoring
Build a bare ground square quadrat (pictured on left). A quadrat can be assembled using 1-inch PVC pipe and string. The quadrat should have 9 strings on a side, totaling 81 intersections that are spaced 2 inches apart. The inner dimension of the frame is 18 inches.
Bare Ground. At each site, lay the quadrat grid flat on the ground. If vegetation is tall, try to work the plants through the grid, as opposed to the grid flattening the plants on the ground. Looking directly down at the grid, count the number of intersections of string that overlay bare ground. Record this number on the data sheet. This should be a whole number (0-81). 3.
Litter depth. At each site, measure the depth of litter at 3-5 locations within the bare ground sampling grid and record the average of these measurements.
Make sure to record both the full name (scientific and/or common name) and the USDA code for each plant encountered.
Bird Sampling
Point count surveys are conducted a minimum of two times during the peak of the breeding season (April – June), dependent on geographic location.
Counts should begin between sunrise and 15 minutes thereafter, and should be completed within 3-4 hours, generally by 10:00 am, and normally never later than 11:00 am.
Each point count is 5 minutes in duration. Set your countdown timer on your watch to 5 minutes and make sure it beeps once that time elapses. If something briefly interferes with your ability to detect birds during the 5-minute count (vehicle drives by, plane flies over, wind gust, short duration animal alarm call), you may pause the point count and resume once the disturbance has subsided.
